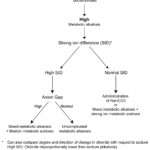
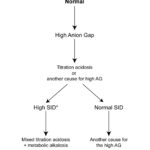
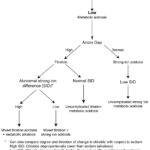
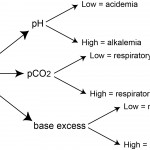
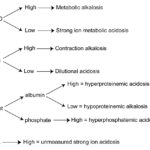
Here we provide quick guides (tables and algorithms) to interpreting changes in acid-base results from a standard chemistry panel.
Simple disturbances
Respiratory disturbances
The following table provides a summary of the changes in the blood gas (pH, pCO2) with primary respiratory acid-base disturbances, based on the type of disturbance. Note, that a respiratory disturbance cannot be detected from a biochemical panel and a respiratory disturbance does not alter BE.
| Disturbance | pCO2 | Effect on pH |
| Respiratory acidosis | ↑ | ↓ |
| Respiratory alkalosis | ↓ | ↑ |
Metabolic disturbances
The following table provides a summary of the changes in the blood gas (pH, HCO3–, BE) and biochemical panel (HCO3–, AG, strong ion difference and chloride changes in relation to sodium) with primary metabolic acid-base disturbances, based on the type of disturbance. The strong ion difference = (Na+ + K+) – Cl–.
| Disturbance | HCO3– or BE |
AG | Strong ion difference | Chloride versus sodium | Effect on pH |
| Titration metabolic acidosis | ↓ | ↑ | normal | normal | ↓ |
| Strong ion metabolic acidosis | ↓ | normal | ↓ | ↑ | ↓ |
| Metabolic alkalosis | ↑ | normal | ↑ | ↓ | ↑ |
Compensation
The table below represents compensatory (secondary) responses to a single primary blood gas disturbance (respiratory or metabolic). As can be seen, the change in the primary parameter (HCO3– for metabolic and pCO2 for respiratory) is paralleled by the compensatory response.
| Primary disorder | pH | [H+] | Primary change | Compensation |
| Metabolic acidosis | ↓ | ↑ | ↓ HCO3– | ↓ pCO2 |
| Metabolic alkalosis | ↑ | ↓ | ↑ HCO3– | ↑ pCO2 |
| Respiratory acidosis | ↓ | ↑ | ↑ pCO2 | ↑ HCO3– |
| Respiratory alkalosis | ↑ | ↓ | ↓ pCO2 | ↓ HCO3– |
Mixed disturbances
Some examples of mixed acid-base disturbances and the changes that ensue are shown in the table below. Note that not all possible combinations are shown in this table. Strong ion difference is calculated as above
| HCO3– | pCO2 | AG | Strong ion difference (SID) | Chloride vs Sodium | Disorders | Expected pH |
| ↓ | ↑ | ↑ | ↑ | ↓ | Primary titration metabolic acidosis (low HCO3– high AG) AND respiratory acidosis (high pCO2) AND primary or compensatory metabolic alkalosis (high SID due to Cl<Na) | N to ↓ (depending on if the alkalosis is primary or secondary) |
| N | N | ↑ | ↑ | ↓ | Primary titration metabolic acidosis (high AG) AND metabolic alkalosis (high SID due to Cl<Na) | N, ↑, ↓ (depends on dominating disturbance) |
| ↑ | ↓ | N | ↑ | ↓ | Primary metabolic alkalosis (high HCO3–, high SID due to Cl<Na) AND respiratory alkalosis (low pCO2) | ↑↑ |
| ↓↓ | ↓ | ↑ | ↓ | ↑ | Primary titration AND loss metabolic acidosis (very low HCO3–, high AG, low SID, Cl>Na), compensatory respiratory alkalosis (low pCO2) | ↓ |
Diagnostic algorithms

