
The sample indexes of lipemia, hemolysis and icterus are part of our chemistry results. They are provided automatically with our analyzer with any chemistry test and are very useful. These indexes are more objective and consistent than visual assessment of a sample. Hemolysis from ruptured red blood cells (whether in vitro as an artifact or in vivo, as part of an intravascular component to a hemolytic anemia), lipemia (usually due to increased chylomicrons or high concentrations of very low density lipoproteins) and icterus (from hyperbilirubinemia) in a sample can, in some cases, interfere with accurate measurement of clinical pathologic analytes through various mechanisms (for more, see interferences under test basics).
Guides as to which tests are affected at different levels for each index are provided with the chemistry results from Cornell University. These are guidelines only (many are based on data from humans, particularly the product information sheet from the manufacturer, and may not be applicable to animals) and should be used carefully to assess the impact of these preanalytical variables (lipemia, hemolysis, icterus) on the chemistry results. When doing this, it is very important to interpret these values along with the clinical signs displayed by the patient and the remaining laboratory results, i.e. they should never be used alone. Remember that the effect of these interferences on chemistry results are also dependent on the analyzer and methods used. They cannot be transferred from one laboratory’s results to another. These guidelines are given below for each interference with the analyzer used in our laboratory (currently the Cobas 501).
Lipemia index
The number reported under lipemia on our chemistry reports is a measure of the lipid content of the plasma. Index values are obtained by adding increasing amounts of an emulsion of fat to a sample (Intralipid®) and assessing the effect the emulsion has on chemistry values. In reality, the lipemia index correlates weakly to the triglyceride concentration in clinical sample and may be more of a reflection of turbidity. In our experience, the units for lipemia index correlate to gross estimates of lipemia as follows:
| Lipemia index | Gross appearance |
|---|---|
| <30 | No lipemia |
| 30-60 | Slight (hazy) |
| 60-120 | Moderate (milky) |
| >120 | Marked (creamy) |
The guidelines below indicate how lipemia, based on the lipemia index, may affect results on our current chemistry analyzer. These guidelines are derived from manufacturer’s recommendations and are based on data from spiking human samples with Intralipid®. These values may not apply to samples from animals and there may be species differences. These guidelines should always be used in conjunction with clinical signs and knowledge of the underlying disease processes as guides for interpreting laboratory data and determining the accuracy of reported laboratory results.
| Lipemia index | Possible effect on tests |
| >60 | Unknown effect with 5th generation reagents: Bile acids (per the manufacturer sheet, a triglyceride concentration up to 750 mg/dL causes a <10% alteration in bile acid results on the Hitachi 707 analyzer). |
| ≥100 | Falsely increased: Direct bilirubin |
| ≥150 | Falsely increased: Direct bilirubin. Falsely decreased: Sodium, potassium (less affected than sodium and chloride), chloride (if triglyceride concentrations are high, e.g. > 600 mg/dL). Note that sodium and chloride concentrations will be proportionately affected by lipemia. Unknown if increased or decreased: ALT, AST. |
| ≥300 | Falsely increased: Direct bilirubin, TIBC. Falsely decreased: Sodium, potassium, chloride (see above). Unknown if increased or decreased: ALT, AST. |
| ≥500 | Falsely increased: Direct bilirubin, TIBC. Falsely decreased: Sodium, potassium, chloride (see above). Unknown if increased or decreased: Albumin, ALT, AST. |
| ≥1000 | Falsely increased: Direct bilirubin, TIBC. Falsely decreased: Sodium, potassium, chloride (see above), LDH. Unknown if increased or decreased: Albumin, ALT, AST, calcium, cholinesterase, CK, glucose, phosphate, total bilirubin, urea nitrogen. |
| ≥1500 | Falsely increased: Direct bilirubin, TIBC. Falsely decreased: Sodium, potassium, chloride (see above), LDH. Unknown if increased or decreased: Albumin, ALT, AST, calcium, cholinesterase, CK, glucose, phosphate, total bilirubin and urea nitrogen. Effect on other analytes: Unknown. |
Hemolysis index
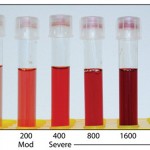
Visible hemolysis becomes evident in a sample when the hemoglobin concentration is at or exceeds 20 mg/mL (corresponding roughly to lysis of 0.5% red blood cells) (Dolci and Panteghini 2014). Our analyzer also provides a hemolysis index, which is a semi-quantitative measurement of the concentration of free hemoglobin in mg/dL. The image to the right shows a visual representation of how these values correspond to visible hemolysis in plasma samples and the table below correlates the index value to this gross appearance.
| Hemolysis index | Gross appearance |
|---|---|
| <20 | No hemolysis |
| 20-100 | Slightly hemolyzed (pink tinged) |
| 100-300 | Moderately hemolyzed (red) |
| >300 | Markedly hemolyzed (dark red) |
Free hemoglobin in the sample has little or no effect on most assays unless the level is very high (>300 hemolytic index). The guidelines below indicate how hemolysis (rupturing of RBCs) may affect sample results from our current chemistry analyzer. These guidelines are derived from manufacturer’s recommendations and is based on data from spiking human samples with hemoglobin (to a maximum of 1000 mg/dL). These values may not apply to samples from animals and there are important species differences (for example, a high potassium is expected in hemolyzed samples from horses, camelids, pigs and sheep because potassium concentrations in the erythrocytes of these species are higher than in serum – this is not true for most breeds of dogs, other than Asian breeds, or several breeds of cattle). These guidelines should always be used in conjunction with clinical signs and knowledge of the underlying disease processes as guides for interpreting laboratory data and determining the accuracy of reported laboratory results. Species-dependent changes have been published, however these will always be method- and analyzer-dependent and are not broadly applicable to results. For more on species-dependent changes, refer to the interference section of test basics.
Note that prolonged storage of serum or plasma on cells may result in altered membrane permeability, with leakage of intracellular constituents that are normally in higher concentration in cells (e.g. potassium, magnesium, organic phosphate which gets converted to inorganic phosphate with storage, and iron, which may dissociate from the heme ring over time).
| Hemolysis index | Possible effect on results |
| ≥19 | Release of RBC constituents (false increase): LDH (in dogs, in our experience; unknown for other species) |
| ≥40 | Release of RBC constituents (false increase): LDH (dogs – see above, pigs) Unclear mechanism (false increase): TIBC. |
| ≥100 | Release of RBC constituents (false increase): LDH (dogs, pigs – see above), potassium (species-dependent – horses, camelids, cats, pigs and some ruminant and dog breeds), CK (constituents in red blood cell membranes can participate in the CK reaction). Unclear mechanism (false increase): TIBC. Unknown if increased or decreased: Fructosamine. |
| ≥200 | Release of RBC constituents (false increase): AST, iron, LDH (dogs, pigs – see above), potassium (species-dependent – see above), CK. Unclear mechanism (false increase): TIBC. General interference (false increase): ALP. False decrease: GGT, likely SDH (Hitachi P modular analyzer) False increase: ALP Unknown if increased or decreased: Fructosamine. |
| ≥300 | Release of RBC constituents (false increase): AST, iron, LDH (dogs, pigs – see above), potassium (species-dependent – see above), CK, phosphate (when organic phosphate gets converted to inorganic phosphate). Unclear mechanism (false increase): TIBC. General interference (false increase): ALP. False decrease: GGT. Unknown if increased or decreased: Fructosamine. |
| ≥500 | Release of RBC constituents (false increase): AST, iron, LDH (dogs, pigs – see above), potassium (species-dependent – see above), CK, phosphate (see above). Unclear mechanism (false increase): TIBC. General interference (false increase): ALP, total protein. False decrease: Amylase, direct bilirubin, GGT, NEFA (by an average of 0.05 mEq/L, range of 0.03 to 0.07 mEq/L). Unknown if increased or decreased: Bile acids (with 5th generation reagents), fructosamine |
| ≥600 | Release of RBC constituents (false increase): AST, iron, LDH (dogs, pigs – see above), potassium (species-dependent – see above), CK (see above), phosphate (see above). Unclear mechanism (false increase): TIBC. General interference (false increase): ALP, total protein. False decrease: Amylase, bicarbonate, direct bilirubin, GGT, NEFA (by an average of 0.05 mEq/L, range of 0.03 to 0.07 mEq/L). Unknown if increased or decreased: Bile acids (with 5th generation reagents), fructosamine |
| ≥700 | Release of RBC constituents (false increase): AST, iron, LDH (dogs, pigs – see above), potassium (species-dependent – see above), CK (see above), phosphate (see above). Unclear mechanism (false increase): TIBC. General interference (false increase): ALP, holesterol, cholinesterase, total protein, triglycerides. False decrease: Amylase, bicarbonate, direct bilirubin, GGT, NEFA (by an average of 0.05 mEq/L, range of 0.03 to 0.07 mEq/L). Unknown if increased or decreased: Bile acids (with 5th generation reagents), fructosamine |
| ≥800 | Release of RBC constituents (false increase): AST, iron, LDH (dogs, pigs – see above), magnesium, potassium (species-dependent – see above), CK (see above), phosphate (see above). Unclear mechanism (false increase): TIBC. General interference (false increase): ALP, cholesterol, cholinesterase, total protein, triglycerides. False decrease: Amylase, bicarbonate, direct bilirubin, GGT, NEFA (by an average of 0.05 mEq/L, range of 0.03 to 0.07 mEq/L). Unknown if increased or decreased: Bile acids (with 5th generation reagents), creatinine, fructosamine, total bilirubin. |
| ≥1000 | Release of RBC constituents (false increase): AST, iron, LDH (dogs, pigs – see above), magnesium, potassium (species-dependent – see above), CK (see above), phosphate (see above). Unclear mechanism (false increase): TIBC, likely GLDH (Hitachi P modular analyzer). General interference (false increase): ALP, cholesterol, cholinesterase, total protein, triglycerides. False decrease: Amylase, bicarbonate, direct bilirubin, GGT, NEFA (by an average of 0.05 mEq/L, range of 0.03 to 0.07 mEq/L). Unknown if increased or decreased: Bile acids (with 5th generation reagents), creatinine, fructosamine, total bilirubin. Effect on other analytes: Unknown. |
Icteric index
Clinical icterus is observed when total bilirubin concentrations exceed 3 mg/dL (Joseph and Samant 2021). Our analyzer also reports a number for icterus index, which is an estimation of the total bilirubin concentration in mg/dL rounded to the nearest whole number.
The icterus index can be used to determine if there is hyperbilirubinemia, i.e. if the total bilirubin is increased, the icteric index should closely match the value seen. For example, a serum sample from a dog that has an icterus index result of “4” has a total bilirubin concentration of approximately 3.5 to 4.4 mg/dL, which indicates that the dog has hyperbilirubinemia. However, if there is a mismatch, e.g. the total bilirubin is 2 mg/dL and the icteric index is 0, the total bilirubin result is falsely increased. This type of artifact is seen in the following situations:
- Underfilling of heparin anticoagulant tubes: If heparin (green top) anticoagulant tubes are <3/4 full with blood, a falsely increased total bilirubin (mostly indirect bilirubin) may be seen (observations at Cornell University).
- Species that normally have lightly colored serum (e.g. birds, ruminants): Carotenoids in the diet (and serum) will contribute to the icteric index (but not the total bilirubin value).
The guidelines below indicate on how tests are affected by icterus with our chemistry analyzer. These guidelines are derived from manufacturer’s recommendations and is based on data from spiking human samples with conjugated or unconjugated bilirubin. These values may not apply to samples from animals and there may be species differences. These guidelines should always be used in conjunction with clinical signs and knowledge of the underlying disease processes as guides for interpreting laboratory data and determining the accuracy of reported laboratory results.
| Icteric index | Possible effect on results |
| ≥6 | Unknown if increased or decreased: Fructosamine. |
| ≥11 | Falsely decreased: Total protein (Garner et al 2014, Gupta & Stockham 2014), triglycerides. Unknown if increased or decreased: Fructosamine. |
| ≥16 | Falsely decreased: Cholesterol, creatinine, total protein, triglycerides. Unknown if increased or decreased: Fructosamine. |
| ≥20 | Falsely decreased: Cholesterol, creatinine, GGT, total protein, triglycerides. Unknown if increased or decreased: Fructosamine. |
| ≥40 | Falsely decreased: Cholesterol, creatinine, GGT, total protein, triglycerides, uric acid. Unknown if increased or decreased: Fructosamine, phosphate. |
| ≥50 | Falsely decreased: Cholesterol, creatinine, GGT, lipase, total protein, triglycerides, uric acid. Unknown if increased or decreased: Bile acids (with 5th generation reagents; note that bile acid concentrations are expected to increase with cholestasis), direct bilirubin, fructosamine, phosphate. |
| ≥60 | Falsely decreased: Cholesterol, creatinine, GGT, total protein, triglycerides, uric acid. Unknown if increased or decreased: Bile acids (with 5th generation reagents), direct bilirubin, fructosamine, phosphate. Effect on other analytes: Unknown. |