
The ability of an instrument to perform a test does not guarantee that the generated results are accurate. Ensuring that laboratory equipment is providing reliable data requires a comprehensive plan that encompasses both common sense practices aimed at preventing errors at each stage of the testing process and standard operating procedures (SOPs) to validate and monitor analyzer performance. These two arms of the plan are known as quality assurance and quality control, respectively (for more on this topic, please refer to the review by Newman and Behling-Kelly 2016).
- Quality assurance (QA) is defined as the laboratory procedures that monitor and strive to improve laboratory performance and minimize laboratory error, e.g. SOPs are written to ensure a minimum standard of practice is followed when using instruments.
- Quality control (QC) is defined as the laboratory procedures that monitor analytical performance of instruments, detecting mostly analytical error.
Quality assurance and control are often undervalued or even ignored, but they are critically important for helping clinicians use laboratory test results to reach a diagnosis, monitor progress, and adopt or modify treatment plans for their patients. The accuracy and precision of test results are paramount to the success of these core tasks. Test results are only as good as the instruments used to generate them and the individuals operating the instruments, overseeing test performance and interpreting their output. Any analyzer, regardless of manufacturers’ claims, requires regular maintenance and testing to monitor its performance. This is analogous to a car that requires regular oil changes and inspections to ensure optimal performance and longevity. No matter how fancy your analyzer is, there will come a time when something will go wrong and it will generate inaccurate and misleading results. This could be due to various factors, such as reagent deterioration or analyzer aging or wear. The goal of a QA plan and QC is to detect these changes as quickly as possible and to implement the required changes to prevent erroneous medical decisions being made on inaccurate data.
Some important terms are:
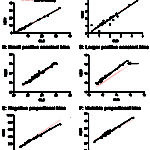
- Accuracy: The closer the measured value from the instrument is to the “real” or “actual” value in the sample, the more accurate it is. Accuracy is determined by the difference between the obtained result and the actual result, which is also called bias, which can be positive (if the measured result is higher than the actual result) or negative (if the measured result is lower than the actual result). The bias can be expressed as an absolute value or the percentage of the actual value.
- Absolute bias = Measured value – actual value
- Percentage bias = ((Measured – actual value) ÷ actual value) x 100
- Constant bias: Bias is consistently positive or negative. Constant bias can be ascertained from the intercept of a regression curve.
- Random bias: Bias is sometimes positive or negative or is not present
- Proportional bias: Bias is proportional (negative or positive) to the concentration of the analyte. Proportional bias can be ascertained from the slope of a regression curve.
- Precision: The closer repeated measurements of the same sample are, the more precise the instrument is. Precision is determined by the coefficient of variation or the standard deviation (spread of data) over the mean. This is expressed as a percentage and can be within run (or day) or between run (or day)
- Coefficient of variation = (SD÷mean) x 100
- Within run precision: This is determined by measuring the same sample (usually 3-5 different samples representing normal, high and low values of the analyte) 10-20 times in one run, using the same instrument, method and reagent.
- Between run precision: This is determined by measuring the same sample (usually 3-5 different ones as stated above) twice daily for 5 different days or once daily for 10 days (as long as the analyte being tested is stable with storage), usually with different operators, but the same instrument, method and reagent. Between run precision is usually higher than within run precision. Most laboratories run and monitor between run precision by running daily controls every time the instrument is in operation.
- Analytical variation: This usually encompasses within and between run precision and bias, but for measurement of index of individuality, it usually only encompasses between run precision.
-
Bias and imprecision Total allowable error: This is the maximum error allowable for a specific test. Acceptable error (or the difference between one measurement and another on the same instrument) for various hematologic, coagulation, biochemical, immunologic and endocrinologic tests have been established by CLIA (Clinical Laboratory Improvement Amendments) and the American Society of Veterinary Clinical Pathology (ASVCP) for many biochemical (Harr et al 2013) and hematologic (Nabity et al 2018) tests.
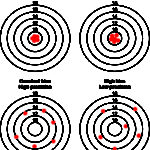
Another way of thinking of bias and imprecision is a target (see image to the right). Hitting off the center of the target is bias whereas hitting different spots on multiple occasions is imprecision as shown below. An assay can be accurate (on target) and precise (consistent), accurate but imprecise (on target, but not consistently), inaccurate but precise (off target consistently) and inaccurate and imprecise (off target and inconsistent – the latter would not be a good assay to rely on). Some imprecision and bias is always going to be present, but should be within the total allowable error for that analyte (see above for definition).
Quality control
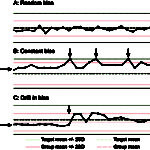
The cornerstone of QC is “running controls,” which means running manufacturer-provided quality control materials (QCM) on an instrument to assess its analytical performance. This is usually performed daily in most veterinary laboratories. Results from the daily QCM from the instrument are compared to the mean, range and standard deviation (SD) provided for the QCM by the manufacturer and should fall within a designated range (typically mean ± 2 SD). If the QCM results are “out”, e.g. >2 SD above or below the mean, this indicates that the machine will not provide accurate results for that test and the instrument should be checked to ensure it is working properly. As part of a QA program, we also check QCM results over time and compare these results to our laboratory cohorts, i.e. other laboratories that are running the same test and QCM on the same instrument. In an ideal world, results for each analyte would be at the target or QCM mean consistently each time the QCM is run, however this is rarely possible and results frequently “jump” around, running sometimes above or sometimes below the mean (this is called random bias, see figure to the right). If your QCM result for any test always falls above the mean, this means there is a constant bias in that test. Again, the instrument can be checked and adjusted to improve performance (see figure to the right), but the reality is that some tests will always run that way and most laboratories accept a certain degree of bias and imprecision.
Many laboratories also participate in external quality control testing, in which samples with unknown results are assayed by the laboratory. For instance, at Cornell University we participate in the College of American Pathologists (CAP) surveys and Veterinary Laboratory Association (VLA) external quality programs. We receive between 2-4 samples a year for our hematologic, blood gas and chemistry instruments and obtain results back, which are illustrated in comparison to our laboratory cohorts or group. If our results are not within acceptable performance or are outliers, that indicates we need to check our instrument operation. Luckily, this rarely ever happens. The ASVCP has also established guidelines for external quality assurance testing (Camus et al 2015).
Note, that although these QA and QC procedures are commonplace in veterinary commercial laboratories, they are not routinely performed with point-of-care instruments or small in-house laboratories at veterinary practices and some manufacturers of these instruments actually claim you don’t have to run QC or that the machine does “internal” QC. Considering how much we use clinical pathology data for diagnosis, treatment and management of veterinary patients, ask yourself….”can I trust these numbers?” A QA program with QC would help give you that reassurance.