
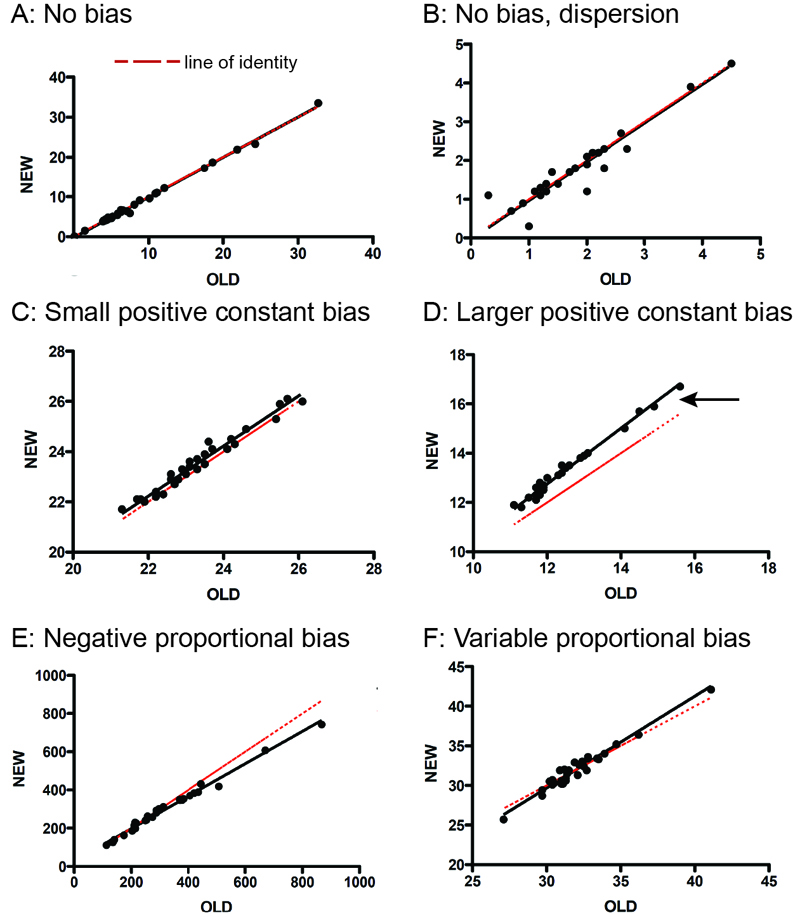
Comparison of different hematologic tests between a new method (Y axis) and old method (X axis). The dots represent samples tested with both methods and the black line is the line of best fit (Passing-Bablock regression equation or y = mx + x. A: No bias: With this test, the agreement is good (high correlation or r squared > 0.98) and the line of best fit overlaps with the line of identity, indicating no bias. There is minimal dispersion around the line of best fit. Here the slope would be close to 1 (no proportional bias) and the intercept would be close to 0 (no constant bias). B: No bias but dispersion: Here there is no bias (line of best fit overlaps with the line of identity) but see how some data points are not on the line of best fit but dispersed variably (above and below) around it. C: Small positive constant bias: Here, the new method is consistently providing results that are slightly above that of the old method (line of best fit is above line of identity by the same amount regardless of analyte concentrations). Which method is more “accurate”, depends on which result is closer to the real value (e.g. obtained from spiking the sample and measuring with a “gold standard” method, which may not always be available). The intercept in the equation above (“b”) gives you an idea of the degree of constant bias. If the confidence interval for the intercept encompasses the value 0, there is no significant bias. D: Larger positive constant bias: In this assay, the new method is providing results that are quite larger than the old method (wider gap between line of best fit and line of identity; see comments above for C). The confidence intervals for the intercept for the regression equation did not encompass 0, indicating significant bias. New reference intervals may need to be established for the new method. Note, the very slight positive proportional bias, where the difference between the line of best fit is broader at higher analyte values (arrow) than at lower values. Note that constant bias can be negative or positive. E: Negative proportional bias: Bias that is dependent on the analyte concentration is called proportional bias and the degree of bias can be assessed from the slope of the above equation (“m”). If the confidence intervals on the slope encompass 1 (= no proportional bias), the changes are not statistically significant. This analyte is showing negative proportional bias. As the analyte values increase, the new method is reading lower values than the old method. Positive proportional bias would be where the new method yields proportionally higher values than the old method as analyte concentration increases. Note that there appears to be minimal bias below 350 units. If the upper limit of the reference interval is below this value, reference intervals may not need to be changed if switching to the new method. The bias would just mean that high values would have been higher with the old method. F: Variable proportional bias: Note how the line of best fit starts below the line of identity, then as analyte concentration increases, the line of best fit falls above the line of identity, indicating a negative bias that switches to a positive bias as analyte concentrations increase. However, the changes are quite mild. Also note how that single data points at each end can skew the data. Collection of additional upper and lower data points may clarify the bias (worsen or eliminate it).
There can be both constant and proportional bias (a hint of which is evident in figure D above), where the slope is different from 1 and the intercept is different from 0.