
Viscoelastic methods of clot detection are increasingly being used in veterinary medicine for diagnosis of these possible hemostatic states: normocoagulable, hypercoagulable, hypocoagulable, excessive fibrinolysis or reduced fibrinolysis (for reviews see Kol and Borjesson, 2010 and McMichael and Smith, 2011). However, there are some important limitations to the use of these techniques to diagnose hyper- or hypocoagulability, in particular, including the type of activator and the hematocrit of the patient. Interestingly, these techniques are more used to evaluate response to treatment in human patients than a diagnostic technique, particularly intraoperatively or during treatment of massive bleeding due to trauma. Some people also use viscoelastic testing to determine the mechanism underlying massive intra-operative or traumatic hemorrhage. There are other uses for these tests, including assessment for platelet inhibitors and functional fibrinogen measurement (Brainard et al., 2014) and fibrinolysis (native or that induced by tissue plasminogen activator) (Spodsberg et al 2013, Fletcher et al 2014, Sigrist et al 2017).
Because viscoelastic assays evaluate cellular and protein components of hemostasis (platelets and coagulation factors), as well as fibrinolysis, they are called global assays of hemostasis. They do have some advantages over traditional clotting assays, that are based on detection of fibrin formation in platelet-poor plasma. These testing methods include platelets (in particular) and other blood cells (leukocytes, erythrocytes), which provide crucial surfaces on which fibrin formation proceeds (although the endothelial component is still missing). They also provide a tracing and numerical results that reflect the dynamic nature of fibrin formation and breakdown versus just an endpoint of the time to fibrin formation. These viscoelastic techniques provide information on the time of onset of fibrin formation, the rate of fibrin formation, the strength of the fibrin clot, and fibrinolysis at defined endpoints. There are different analyzers that perform viscoelastic testing, including the ROTEM®, TEG® and Sonoclot®, results of which are not directly comparable (McMichael et al 2014). Even the same type of analyzer does not yield comparable results in different institutions when subjected to standardized testing (Goggs et al 2018). To add confusion, each company uses specific terminology for the technique and results, which is only applicable to their analyzer, although the provided results provide similar information. With the ROTEM® , the technique is called thrombelastrometry and with the TEG® analyzers, the technique is called thrombelastography (abbreviated to TEG; the latter should only be used for results obtained from TEG® analyzers and not those from the ROTEM® or Sonoclot®). This section will focus on the TEG® and ROTEM®, because these are the instruments used in most publications.
Method of measurement
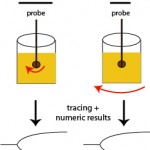
With these techniques, patient whole blood is added to a cup in which a pin or torsion wire is placed. Calcium is then added to the sample, along with an activator (if desired) and then either the pin (ROTEM®) or cup (TEG®) rotates, yielding movement between the pin and the cup. When the activator is added or the blood is recalcified (adding calcium only for native or unactivated samples), small amounts of thrombin are generated. This small amount of thrombin then activates platelets, which flip their membranes exposing phosphatidylserine which supports assembly of coagulation factor complexes and amplifies and propagates thrombin generation. Once larger amounts of thrombin are formed, thrombin cleaves fibrinogen to form fibrin. The lag time between the start of coagulation and the time for fibrin to start forming is called the reaction time or clot time (depending on the instrument, see below) and is mostly dependent on coagulation factors (and hematocrit), but not platelets or fibrinogen. Fibrin strands that are forming restrict the movement between the pin and the cup. The change in movement is relayed through the pin and detected optically (ROTEM®) or electronically (TEG®) and converted to a fibrin formation curve, with corresponding results on the rate, amount and strength of fibrin formation (which is affected by hematocrit, coagulation factors including fibrinogen, and platelet number and function). As the fibrin lyses (dependent on the fibrin clot, and tPA in blood), movement between the pin and the cup becomes unrestricted and is also monitored by the instrument, yielding information on clot lysis.
Provided results
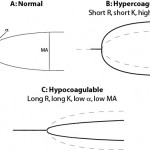
The instruments provide a tracing reflecting the rate of fibrin formation and fibrinolysis. Defined numerical data is also provided, although the terminology varies between instruments (see table below for routine coagulation results). For fibrinolytic results, the change in amplitude compared to maximal amplitude is measured at 30 and 60 minutes. A greater change in amplitude indicates less clot remaining and more rapid fibrinolysis. Based on the combined data, a patient can be defined as normocoagulable, hypercoagulable (prothrombotic) or hypocoagulable (prohemorrhagic). If fibrinolysis occurs quickly (compared to that in normal animals), the animal is hyperfibrinolytic (which could cause hemorrhage). Conversely, if fibrinolysis is delayed, the animal is hypofibrinolytic (which would promote clot formation or thrombosis). There is a wide range of fibrinolysis in healthy animals. Thus, to obtain more standardized fibrinolytic results, a set concentration of tissue plasminogen activator can be added to stimulate fibrinolysis. Using this technique, a decreased rate of fibrinolysis (hypofibrinolysis) has been identified in some dogs with disorders associated with thrombosis (e.g immune-mediated hemolytic anemia), however no direct association between thrombosis and abnormal test results were made (Spodsberg et al., 2013).
Unfortunately, there is no consensus on how the data is used from these instruments, although this may change (Hanel et al., 2014). Some investigators use one abnormal result to classify the hemostatic state in an animal, whereas others use a minimum of two abnormal results. Others use a mathematical formula combining results (overall coagulation index) or the elastic shear modulus (a mathematical derivation of MA) to define the hemostatic state in an animal.
| Result | Name (TEG®) | Name (ROTEM®) | Hypercoagulable | Hypocoagulable |
| Time until onset of fibrin formation | Reaction time (R) | Clot time (CT) | Short R or CT | Long R or CT |
| Rate of fibrin formation | K and α | Clot formation time (CFT) | Short K, high α, short CFT | Long K, low α, long CFT |
| Strength of the fibrin clot | Maximum amplitude (MA) | Maximum clot firmness (MCF) | High MA or MCF | Low MA or MCF |
Test interpretation
Platelet number and function, coagulation factor activity, including fibrinogen, and hematocrit all influence the results (Smith et al., 2012). In general the reaction time is thought to reflect coagulation factors primarily, whereas rate of clot formation and strength of clot will be affected by platelet number and function, fibrinogen concentration and coagulation factor activity. Hypocoaguable tracings are expected in severely thrombocytopenic dogs (platelet count <30,000/uL) and viscoelastic testing may not yield additional information about overall hemostatic state in such animals. The fibrinogen concentration also strongly impacts results, except for the reaction time (R or CT). A high fibrinogen is strongly associated (correlation >0.70 in most studies) with clot strength (high MA) and to a lesser extent, K (increased) K and α (decreased). The converse is also true (low fibrinogen will cause decreased clot strength etc). Thus, results should not be interpreted without knowledge of the fibrinogen concentration and platelet counts. Also, hematocrit influences all these results (high values leads to hypocoagulable tracings and low values lead to hypercoagulable tracings), which limits diagnostic utility of the test (McMichael et al., 2011, Smith et al., 2012). Studies have also shown that, depending on the activator, population-based reference intervals may not be appropriate. For example, test results for R, K, and α, from TF-activated (1:50,000) thromboelastography in horses have a high index of individuality, indicating population-based reference intervals are appropriate for interpreting test results. In contrast, TF-generated MA and LY60, kaolin-generated MA, α and LY60 have a low index of individuality, indicating that critical differences are more appropriate for test determination due to high biologic variation (Hyldahl Laursen et al., 2013).
| Hemostatic state | Viscoelastic results | Notes |
| Hypercoagulable | Combination of short R (CT), short K (CFT), high α, or high MA (MCF), high overall coagulation index | Low hematocrit and high fibrinogen may yield similar results (for some measurements) |
| Hypocoagulable | Combination of long R (CT), long K (CFT), low α, or low MA (MCF), low overall coagulation index | High hematocrit, low fibrinogen and thrombocytopenia may yield similar results (for some measurements) |
| Hyperfibrinolytic | Increased percent clot lysis at 30 or 6o minutes (less clot remaining) | Will be affected by the strength and amount of the fibrin clot in the first place. A weaker clot will be lysed more rapidly. |
| Hypofibrinolytic | Decreased percent clot lysis at 30 or 60 minutes (more clot remaining) | See hyperfibrinolytic |
Many variables affect result interpretation (Smith et al., 2010, deLaforcade et al., 2014, Flatland et al., 2014). These variables should be considered when interpreting data and include the following:
- Type of sample: Testing can be done on unanticoagulated or anticoagulated (citrate) whole blood. Studies have shown that results are more variable with unanticoagulated blood and this also needs to be done right next to the patient (to prevent clotting before the sample is added to the cup), adding to the variability of results. For this reason, most investigators use anticoagulated blood.
- Activator: The sample can be run without an activator (native) or with an activator that triggers clotting. Results from native blood generally indicate contact activation (contact with the cup), with activation of FXII and the intrinsic pathway of secondary hemostasis. Results are more variable with native than activated blood (Hyldahl Laursen et al., 2013), hence most investigators use an activator, although the type of activator and amount used varies between studies. Activators can either stimulate the extrinsic (i.e. a cell-based PT) or intrinsic (i.e. a cell-based APTT) pathways of hemostasis. Results obtained from different activators (or activator concentrations) are not comparable. The activators may also mask the effect of anti-platelet drugs, such as aspirin (these may not inhibit platelet activation induced by the thrombin burst). Activators also shorten the time to clot formation and have higher clot strength (due to more robust thrombin generation) than non-activated samples.
- Extrinsic pathway: Usually dilute concentrations of tissue factor (1:50,000) are used to activate clotting. Studies by Dr. Brooks at Cornell University have shown that TEG profiles are normal in dogs with hemophilia A, indicating that that the tissue factor driven test is analogous to a PT (which would be normal in these dogs with factor VIII deficiency).
- Intrinsic pathway: Just like the APTT, various activators can be used, including kaolin and ellagic acid. Studies by Dr. Brooks at Cornell University have shown that TEG profiles are abnormal (no clot formation occurs with a very long R) in dogs with hemophilia A, as expected for this defect.
- Timing of sample analysis: Tracings become more hypocoagulable with increasing time after sample collection, so testing should be standardized to a specific time. This is usually 30 or 60 minutes. Results from different times are not comparable.
- Hematocrit: As indicated above, studies have shown that hematocrit influences all results. Lower hematocrits lead to hypercoagulable tracings with higher hematocrits causing the opposite trend. This is thought to be an artifact of the change in red blood cell number versus reflecting a real change in vivo. This severely impacts the use of this test to diagnose hyper- and hypercoagulable disorders in anemic or polycythemic patients.
- Viscosity: In vitro studies suggest that viscosity will alter tracings independently of hematocrit, i.e. decreased viscosity will lead to hypercoagulable tracings (Brooks et al., 2013).
- Interferents: Hemolysis (accomplished by freeze-thawing of RBCs ex vivo) impacted kaolin-activated TEG variables, resulting in hypocoagulable tracings, with higher K, lower alpha and decreased MA (Bauer et al 2010).