
Similar to the red blood cell (RBC) indices of MCV, MCH and MCHC or the equivalent optical measured results for the latter – CH and CHCM, flow-based hematology analyzers can provide indices for RBCs separated into mature cells and reticulocytes, with the latter being based on RNA detection with fluorescent dyes. The ADVIA hematology analyzer gates RBCs into mature and reticulocytes and provides a substantial number of indices for each population as well as the overall gated population (mature plus reticulocytes) as shown in the table below. The mature and reticulocyte population results are distinguished from each other by normal or lower case “mature” for mature cells and normal or lower case “r” or “-r” for reticulocytes. The entire gated population does not have any type of designation.
| Result for each population | Meaning |
| MCV | Mean cell volume |
| CHCM | Mean cell hemoglobin concentration calculated from the optically measured (light scatter) for cellular hemoglobin (CH) |
| CH | Cellular hemoglobin measured by light scatter properties |
| CHDW | Variation (distribution width or SD÷mean) of the CH concentration within the RBC population |
| RDW | Variation of the cell volume within the RBC population |
| HDW | Variation of the CHCM within the RBC population |
| % Micro | Percentage of cells with a cell volume below a designated value set by the analyzer |
| % Macro | Percentage of cells with a cell volume above a designated value set by the analyzer |
| % Hypo | Percentage of cells with CHCM below a designated value set by the analyzer |
| % Hyper | Percentage of cells with CHCM above a designated value set by the analyzer |
| % Low CH | Percentage of cells with CH concentrations below a designated value set by the analyzer |
| % High CH | Percentage of cells with CH concentrations above a designated value set by the analyzer |
| MCV delta | Difference in the MCV between reticulocytes and mature RBCs |
| CHCM delta | Difference in the CHCM between reticulocytes and mature RBCs |
| CH delta | Difference in the CH between reticulocytes and mature RBCs |
| CHDW delta | Difference in the CHDW between reticulocytes and mature RBCs |
| RDW delta | Difference in the RDW between reticulocytes and mature RBCs |
| HDW delta | Difference in the HDW between reticulocytes and mature RBCs |
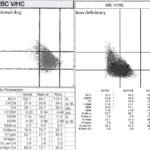
Several studies have been done evaluating the usefulness of the ADVIA reticulocyte indices for identifying iron deficiency in dogs (Steinberg and Olver 2005, Radakovich et al 2015, Schaefer and Stokol 2015). The premise behind this is that just looking at the overall gated RBC indices of MCV, MCH or MCHC does not provide sensitive information about iron deficiency because you are evaluating all RBCs, regardless of how young or old they are, and in dogs, RBCs live for as long as 120 days. Thus, the overall RBC indices is less sensitive to decreases in iron availability, which will manifest first in reticulocytes before it manifests in the mature RBC population (as you have to wait for the reticulocytes to mature, which takes around 2-3 days in the dog). Studies in humans have shown that the reticulocyte indices of CH (CHr) and % low CH (% low CHr) are more sensitive to early iron deficiency than using the standard RBC indices (from the entire RBC population), such as that due to a functional iron deficiency secondary to marked erythropoiesis stimulated by erythropoietin administration. The marked erythropoiesis does not allow iron stores to be released rapidly enough to create the normal hemoglobin content in the newly formed reticulocytes leading to a state of functional (not absolute) iron deficiency (iron stores are there, they are just not released rapidly enough). In these people, CHr will decrease before the CH (entire RBC population) or MCH. In a study of dogs with absolute and functional iron deficiency (anemia of inflammatory disease, portosystemic shunts) and dog breeds with breed-associated microcytosis, overlap between all reticulocyte indices was seen in iron deficient dogs (e.g. chronic gastrointestinal blood loss) and the other conditions, although the least overlap was evident with CHCMr, CHr, % Hypo-r and % low CHr. From this cohort (which only had low numbers of dogs in each group due to stringent criteria for inclusion), cut-offs were determined for differentiating absolute iron deficiency from functional iron deficiency and breed-associated microcytosis. These were: ≤26 g/dL for CHCMr, ≤20 g/dL for CHr, ≥74% for % Hypo-r and ≥51% for % low CHr, however these cut-offs did compromise sensitivity of these test results for detecting iron deficient erythropoiesis (Schaefer and Stokol). The image shows ADVIA RBC scatter plots and reticulocyte indices for a clinically healthy dog and a dog with iron deficiency anemia. Similarly, another study showed that the CHr concentration could not discriminate between functional iron deficiency due to inflammation from true iron deficiency from depletion of iron stores (Radakovich et al 2015). Note that the Procyte analyzer does provide an equivalent to the CHr, called the “reticulocyte hemoglobin equivalent”, which shows some correlation with a negative bias (particularly at lower concentrations) compared to the ADVIA CHr (Fuchs et al 2017). We have used these reticulocyte indices to show that some dogs with regenerative anemia due to immune-mediated hemolysis have iron-deficient reticulocytes, which was associated with a lower reticulocyte count, suggesting some dogs with this condition may benefit from iron supplementation (Schaefer and Stokol 2016).