
Serum protein electrophoresis (SPE) separates proteins into multiple bands using an electrical field and can be done in various media, including cellulose acetate (largely replaced), agarose gel or liquid within a capillary tube (capillary zone). These all separate the proteins into distinct bands or fractions. The fractions are separated by charge and size. Albumin is the most abundant single protein in serum and forms a single distinct band in the gel. The globulins are further separated, usually into several bands, including alpha (α), beta (β) and gamma (γ), with further splits of alpha into α1 and α2 and beta into β1 and β2, and . Even though there is one peak in each of the separated components, there are actually multiple proteins within many of the peaks, i.e. one peak is not equivalent to one protein. At physiologic pH, most proteins are negatively charged, with albumin having a stronger negative charge and migrating further towards the positive anode, whereas immunoglobulins have the weakest negative charge and are closer to the negatively charged cathode. The anode is usually illustrated on the left of the electrophoretogram (making albumin the first peak) with the cathode on the right of the electrophoretogram, making immunoglobulins the last peak.
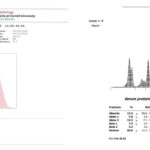
The proteins can be visualized as a densitometric tracing and semi-quantified as a percentage from the area under the curve of the tracing. The percentage is converted to an absolute concentration using a total protein concentration obtained from a chemistry analyzer (akin to a white blood cell count enabling a differential cell count percentage to be converted to an absolute differential cell count). Every SPE result should have two components, an image of the densitometer tracing, and a table of the concentrations of protein within each band.
Serum protein electrophoresis is most commonly performed to distinguish between hyperglobulinemia caused by an innate or acquired immune response or both (an acute phase response for innate immunity and a “polyclonal” gammopathy for acquired immunity) from hyperglobulinemia caused by the neoplastic proliferation of a clone of B lymphocytes or plasma cells (“monoclonal” gammopathy). Serum protein electrophoresis is not typically useful in cases of hypoproteinemia or to confirm an immunodeficiency. Electrophoresis is not the appropriate method for quantifying individual immunoglobulins or immunoglobulin levels against a specific antigen (e.g. infectious agents).
Electrophoresis can also be performed on other fluids, including urine (for potential identification of monoclonal proteins in animals with suspected multiple myeloma with immunofixation; see more below), body cavity fluids (e.g. peritoneal fluid for supporting the diagnosis of feline infectious peritonitis, but this is not commonly done) and cerebrospinal fluid (for various neurologic diseases; again this is not commonly done).
Method of measurement
Electrophoresis separates proteins of body fluids into multiple bands using different media as described above. At Cornell, we used to use agarose gel electrophoresis, which is the method used for most of the images in this page (unless noted otherwise), but are now using capillary zone electrophoresis.
- Agarose gel electrophoresis: The procedure begins with applying an aliquot of the serum to a gel. The gel contains an alkaline buffer, and in this environment, all the proteins have a negative charge of different magnitude. A strong electrical current then is passed through the medium for a set time period. During this time the proteins migrate from the application point toward the positively charged anode for varying distances related to their charge, size, and shape. More than one type of protein may migrate to the same location in the gel (therefore, one peak may contain many different proteins). Albumin has the strongest negative charge in the alkaline gel environment and is one of the smallest proteins in serum. Due to the charge and small size, albumin migrates the furthest. Large and more weakly charged proteins, such as the immunoglobulins, may migrate very little within the electrical current. After a set period, the gel with the separated proteins is removed and immersed in a solution which stains the protein. Several stains can be used, which have different affinities for the proteins in serum, e.g. colloidal blue, sudan black, acid blue. These stains may give different results or may highlight different bands, therefore the same method should be used when comparing results in an individual patient. The agarose gels used to be stained with acid blue in our laboratory. Clearing the gel in acetic acid reveals a series of bands at different positions; the width and density of the bands depends on the amount of proteins with that particular electrophoretic mobility. After drying, the gel can be inspected visually for the distribution of bands. Each band on the gel represents one or more proteins with similar size and charge characteristics. Albumin is the most abundant single protein in serum and forms a single distinct band in the gel. The globulins are further separated into as many as 12 bands, depending on the species and the underlying disease processes. These bands are assigned into groups or fractions typically designated α1, α2, β1, β2, and γ, based on their location relative to albumin (α globulins are right next to albumin with γ globulins being the furthest away from albumin). The gel is then placed in an instrument, called a densitometer, which determines the amount of protein in each band by its absorbance of light. The densitometer translates this information into a series of peaks called an electrophoretogram. The technologist and clinical pathologist make the (somewhat subjective) decision of how to divide the peaks into the several fractions. The area under each curve is proportional to the percentage of that fraction in serum. The concentration of protein in each fraction in serum is determined by multiplying the total protein concentration of the fluid (obtained from the chemistry analyzer, by the Biuret reaction) by the percentage value of each fraction (i.e. absolute protein fraction in g/dL = total protein in g/dL x % from densitometer). The absolute values are then compared to reference intervals for the concerned species, if available.
Agarose versus capillary zone - Capillary zone electrophoresis (CZE): This is the technique currently used at Cornell University. The aliquot of serum (or other type of fluid) is added to a liquid electrolyte solution and pulled through a silica-based capillary tube (from anode to cathode) by an electrical current, which creates endo-osmotic flow towards the negatively charged cathode. An ultraviolet detector connected to a photomultiplier tube is located at the cathode and measures the absorbance of the ionic molecules as they pass through. The molecules migrate through the tube based on charge and size, with less negatively charged molecules, such as immunoglobulins, migrating closer to the cathode and separating out first followed by more negatively charged particles with lower charge to mass ratios (bigger) and then higher charge to mass ratios (smaller), namely albumin. The ultimate product from CZE is similar to agarose gel, in that it yields a tracing of the different fractions as well as a visual representation of the absorbance intensity, similar to a stained gel. In-house comparisons of agarose gel electrophoresis and CZE in our laboratory shows similar results, except that the heights of the peak differ (and differs with species). The resolution of the capillary zone is greater with the more negatively charged molecules, such as albumin, where two peaks can be observed in some animals (and more commonly in some species, such as horses) versus the gamma region, where it can be difficult to distinguish a polyclonal from a monoclonal gammopathy (Keren 1998).
Interpretation
The contents of the alpha, beta, and gamma bands in serum protein electrophoresis are quite varied, but in most species the most clinically relevant ones can be summarized as follows:
- Alpha (α1 and α2): Acute phase proteins, e.g. haptoglobin, α1-acid glycoprotein. In humans, high-density lipoproteins (HDL) can migrate in this region. In dogs, HDL appears to migrate closer to albumin than the globulins (per Dr. Behling-Kelly’s work at Cornell University with agarose gel electrophoresis).
- Beta (β1 and β2): This is a heterogenous group, which includes acute phase proteins, lipoproteins (in humans, low-density lipoproteins [LDL] are considered β-lipoproteins, whereas very low-density lipoproteins [VLDL] are considered pre-β lipoproteins; in dogs, internal studies by Dr. Behling-Kelly shows that VLDL migrate in the β1 region and that LDL migrate in the γ region), immunoglobulins (some isotopes of IgG, e.g. IgG1 in the dog, IgM and IgA), and other proteins, e.g. transferrin (a β1-globulin). Fibrinogen, a β2-globulin (which delineates the junction between beta and gamma globulins), should not be present in an electrophoretogram because the test should be run on serum not plasma.
- Gamma (γ): Usually IgG, however IgM and IgA span the late β2-γ region.
The shape of the electrophoretogram tracing and the quantity of protein in the different fractions provides information about the underlying disease, i.e. interpretation of electrophoresis results are both qualitative and quantitative – the pattern of changes in the tracing are interpreted with the absolute results and reference intervals for the species (if available). If unavailable, we refer to the literature for a guide to help us interpret the changes, however results are very dependent on the method used to obtain the results (see above).
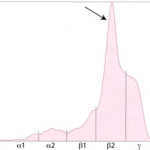
In healthy animals, there is abundant albumin, small amounts of α and β globulins and a mixture of immunoglobulins, which produces a small broad curve in the γ-region In general, we recognize the following disease processes in an electrophoretogram (see above tracing):
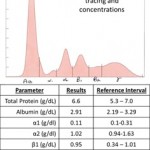
- Acute phase response: This is an innate immune response to inflammation, trauma, infection or tissue injury. This is characterized by an increase in α-globulins (usually α2-globulins in most species). Fibrinogen is also a positive acute phase protein, however this protein should be absent in serum samples. This response occurs very rapidly, i.e. within hours, of an appropriate stimulus.
- Polyclonal gammopathy: This indicates an acquired immune response to an antigenic stimulus, with immunoglobulin production by many different B lymphocytes. Different immunoglobulins (IgG, IgM, IgA) as well as different isotopes of the same immunoglobulin (e.g. IgG1, IgG2a, IgG2b) are produced, resulting in an increase in γ (and usually β) globulins that form a broad base and a wide peak. This is a polyclonal gammopathy. Since it takes about 7-10 days for an antibody response (anamnestic response to an antigen), this type of gammopathy takes a few days to develop. There are many different situations that result in a polyclonal gammopathy, including infections, inflammation, liver disease, and respiratory disease. If the source of antigenic stimulation is also concurrently producing an acute phase reaction, an electrophoretogram will show an acute phase response and a polyclonal gammopathy (feline infectious peritonitis is a classic example of this type of electrophoretogram).
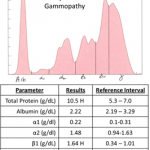
- Monoclonal gammopathy: This indicates that a single clone of immunoglobulins is being produced by a B cell or plasma cell and results in a narrow band (similar to the width of albumin) in the β or γ region of the electrophoretogram. This is usually due to a neoplasm of plasma cells (e.g. extramedullary plasmacytoma, multiple myeloma) or, less commonly, B cells (lymphoma, chronic lymphocytic leukemia).
- Restricted oligoclonal gammopathy: In rare cases, an infectious organism can incite a restricted expansion (even clonal expansion) of a specific clone of lymphocytes, resulting in a “monoclonal-like” response. In most cases, this is not a “true” monoclonal and is actually a restricted oligoclonal (reflecting the expansion of very low numbers of lymphocytes), but in some cases the electrophoretogram pattern mimics a true monoclonal gammopathy, but the involved immunoglobulin is typically IgG. We have seen this type of response with Streptococcus zooepidemicus infection in cats and Ehrlichia canis in dogs. It has also been reported with Leishmania (Font et al 1994) and Angiostrongylus vasorum infection (Kéfer et al 2025).
Artifacts
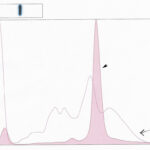
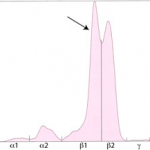
Hemolysis results in the formation of hemoglobin-haptoglobin complexes. In dogs, cats and horses, this complex typically migrates in the β-2 region (see image to the right), however, this is not true for all species. In iguanas, hemoglobin migrates in the β-2 region, whereas in pond sliders, hemoglobin migrates in the α-1 and β-globulin fractions (Giménez et al 2010).
Acute phase response
The acute phase proteins migrate in the α- (mostly) and β- regions of the electrophoretogram and the immunoglobulins comprise the bulk of the γ-region (although IgA, IgM and specific subclasses of IgG can migrate in the late β-region). As many acute phase proteins are α globulins, an increase in concentration of α1 or α2 globulins is a sign of an acute phase response, and is detectable soon after the onset of inflammation, injury, or infection and may persist until inciting stimulus has resolved. As indicated above, this response occurs rapidly (within hours) and decreases rapidly. Direct measurement of positive acute phase proteins, e.g. C-reactive protein in dogs, α1- acid glycoprotein, haptoglobin in cattle, serum amyloid A in horses) is a more accurate way of evaluating the acute phase response. Note, that some acute phase proteins are increased by drug treatment. For example, glucocorticoids will increase haptoglobin and result in an α2-globulin peak in dogs. Also, the lack of an increase in α-globulins does not exclude an underlying acute phase response. We only observe an increase in α-globulins when acute phase proteins normally found in high concentrations (milligram or gram quantities, e.g. haptoglobin) are increased in serum. Acute phase proteins found in smaller amounts (nanogram or picogram quantities, e.g. serum amyloid A) will not result in an increase in α-globulins, even when markedly increased in serum. Thus, measurement of specific acute phase proteins is a more sensitive test of the acute phase response than electrophoresis.
The typical findings on SPE of the acute phase response are:
- Normal to mild increase in total protein (from the chemistry analyzer, but included on the SPE report)
- Normal to mild decrease in albumin (negative acute phase protein)
- Variable increase in α1- or α2 globulins
Polyclonal gammopathy
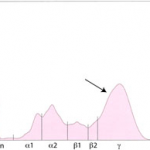
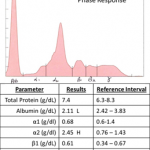
Inflammation, infection or antigenic stimulation of any cause (e.g. chronic liver, respiratory , gastrointestinal, or dermatologic disease) can induce the secretion of mixed immunoglobulins. Immunoglobulins migrate in the γ and β regions (most isotopes of IgG migrate in the γ peak; IgA and IgM migrate in the early γ and extend into the β peak). Immunoglobulins produced by lymphocytes and plasma cells in immune responses are from a variety of lymphocyte or plasma cell clones and include a variety of immunoglobulin classes. Therefore, they tend to migrate to slightly different points on the electrophoretogram, resulting in an increased concentration of γ (and also usually β) globulins, with peaks in the β and γ regions of the tracing that are taller than normal and wider than the albumin peak at both the base and (to some extent) the tip. Such broad-based peaks in the γ region are described as polyclonal gammopathy.
The typical findings on SPE of a polyclonal response are:
- Increase in total protein (from the chemistry analyzer). On some occasions, the total protein concentration can be normal.
- Broad-based peak usually spanning the β and γ regions.
Some diseases can produce a concurrent acute phase response and a polyclonal gammopathy, e.g. Feline infectious peritonitis in cats, Leishmania infection in dogs (often a broad based beta peak [Bertazzolo et al 2022]), systemic inflammation. In these cases, you will typically see the following ELP pattern:
- Increase in total protein (from the chemistry analyzer).
- Broad-based peak usually spanning the β and γ regions (polyclonal gammopathy).
- Normal to mild decrease in albumin (negative acute phase protein)
- Increase in α1- or α2 globulins (acute phase response).
Monoclonal gammopathy
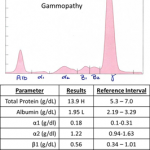
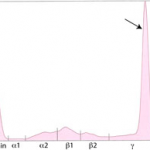
Immunoglobulins produced by a single clone of B lymphocytes or plasma cells typically forms a tall narrow peak in the β- to γ-region (depending on the involved immunoglbulin). This is called a monoclonal gammopathy. A monoclonal gammopathy is usually due to the following:
- Immunoglobulin-secreting B-cell neoplasms, e.g. chronic lymphocytic leukemia or lymphoma of B cells.
- Plasma cell tumors, e.g. extramedullary plasmacytoma, solitary myeloma of bone, and multiple myeloma.
B-cell tumors usually produce IgM or IgG monoclonal gammopathies, whereas IgG or IgA monoclonal proteins are typically secreted by plasma cell tumors. Uninvolved immunoglobulins are usually decreased (secondary immunodeficiency) in patients with these neoplasms, which can help differentiate a true monoclonal expansion from a restricted oligoclonal or a “monoclonal-like” expansion secondary to an infectious agent (in which the involved immunoglobulin is usually IgG and immunoglobulin A and M concentrations are not usually decreased). A study using serum electrophoresis and immunofixation showed a monoclonal IgA gammopathy and weak monoclonal IgG gammopathy in a dog with Ehrlichia canis and heartworm disease, respectively. An obvious monoclonal peak was not evident on routine serum agarose gel electrophoresis in either case, although the IgA in the dog with E. canis migrated in the beta1 region (Jornet-Ruis et al 2024). The latter study also showed that a monoclonal-like band (tall thin peak) with a broad base can be seen in dogs with infectious disease, particularly heartworm disease, with marked expansion of IgG4, which is considered more of a polyclonal than clonal response. In another dog with E. canis and a monoclonal IgA, the IgG4 was found in the beta2 region.
Unusual gammopathies
- “Split monoclonal” gammopathy: This term is applied when two monoclonal peaks are present. In our experience, this pattern is usually due to monoclonal IgA (which can dimerize). In some cases, this is be due to the secretion of two different immunoglobulins, i.e. a true “biclonal” gammopathy (Harris et al 2021). Immunofixation is always advised in such cases.
- “Restricted oligoclonal” gammopathy: This term is applied to a tall narrow “monoclonal-like” peak superimposed upon a broad “polyclonal-like” base. We and others see this pattern frequently in dogs and cats with immune-mediated, infectious or inflammatory conditions, e.g. severe lymphoplasmacytic stomatitis, Ehrlichia canis infection (Jornet-Ruis et al 2024). It is caused by the stimulation of specific B cells resulting in secretion of a few, restricted classes of immunoglobulins. However, this type of electrophoretogram could also be due to a neoplasm of lymphoid cells in an animal with concurrent antigenic stimulation. We have rarely seen cases of 4 monoclonal-like peaks in the serum of dogs, which we presume is a form of a restricted oligoclonal gammopathy.
Immunofixation
Immunofixation is usually performed in conjunction with agarose gel electrophoresis and involves the application of antibodies against the heavy chain of immunoglobulins (IgG, IgM, IgA) and light chains (kappa, lambda), which could be in the bound or free form. Immunofixation is now the preferred method for confirmation of the type of immunoglobulin involved in plasma cell or B cell neoplasms when there is a defined clonal gammopathy (mono-, bi- and potentially oligo-clonal) on standard electrophoresis, but can also identify a “hidden” monoclonal protein that is present in low concentration and within a polyclonal group of proteins (Moore and Avery 2019, Moore et al 2021 part 1 and 2). It is also the preferred method for detecting Bence-Jones protein in urine or free light chain (Harris et al 2021). This test is offered by Colorado State University.