
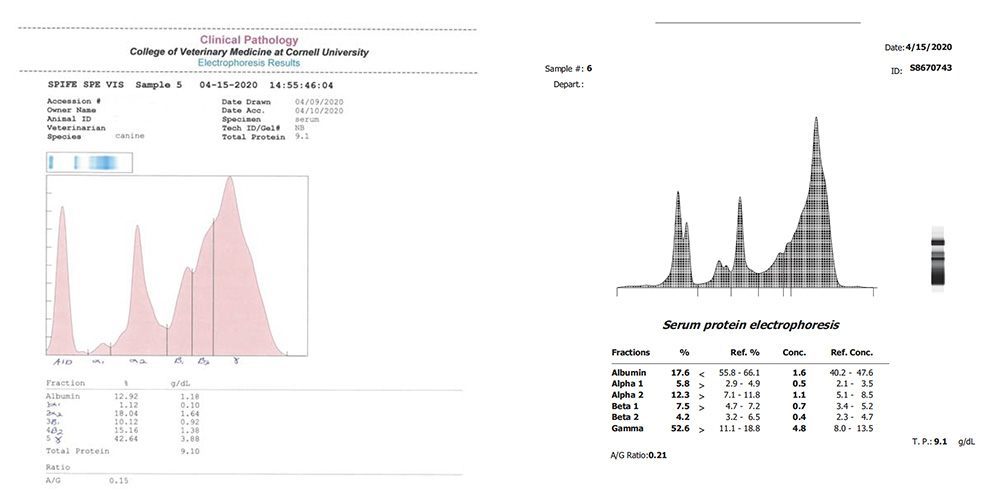
The images on the left shows the stained gel (upper image with blue bands) and associated densitometer tracing (lower image) with agarose gel electrophoresis. The dog has a polyclonal gammopathy with a somewhat sharp peak, supporting a component of a “restricted” response or an expansion of a subset of B or plasma cells (usually in response to an infectious agent). There was a concurrent acute phase response or increase in alpha2 globulins, such as haptoglobin. The images on the right shows the corresponding capillary zone electrophoresis tracing (left image) and banding pattern from the absorbance (right image). Note how two peaks in albumin are evident, showing better resolution towards the anode (positively charged electrode) and a sharper peak that is less symmetrical in the gamma region. Both electrophoretograms use the same total protein concentration (obtained from a chemistry analyzer) but yielded different absolute concentrations. We see generally higher albumin and alpha1 globulin concentrations, with lower alpha2 globulin concentrations in dogs. The beta and gamma fractions are similar (different cut-offs were applied to the beta and gamma fractions in the two tracings so add up the beta2 and gamma fractions for each).