Search Results for: Certified-Strategy-Designer Reliable Test Practice 🤎 Certified-Strategy-Designer Reliable Test Pdf ✡ Certified-Strategy-Designer Reliable Test Practice 🚀 Copy URL ▛ www.pdfvce.com ▟ open and search for 《 Certified-Strategy-Designer 》 to download for free ☸Certified-Strategy-Designer Exam Pass Guide

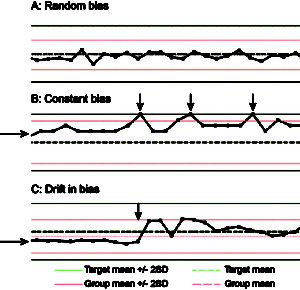
Monitoring trends in quality control material

Quality control material are run daily and monitored over time: The results for the instrument over time is the black line with the red results indicating the mean (red dashed line) and 2SD (+ and -, solid red lines) of all the results compiled from thousands of laboratories using your type of instrument for that test. The green lines indicate the target or expected mean (dashed green line) and 2SD (solid green lines). A: Random bias: The contr…

Monitoring trends in quality control material Read More »

June 2016 Case of the Month

…possible sternal and tracheobronchial lymphadenopathy. Fine needle aspiration of peripheral lymph nodes was performed (the cytologic results will be discussed in the Explanation section). Bone marrow aspiration was also performed. Evaluate the representative images of the bone marrow below and answer the following questions: What is the major process occurring in the bone marrow? Why is the dog thrombocytopenic? What additional diagnostic test

June 2016 Case of the Month Read More »

February 2017 Case of the Month

Peritoneal fluid from an alpaca Case information A 6 year old female alpaca presented to the Cornell University Large Animal Hospital with a history of recumbency, anorexia, and dull mentation. Initial physical examination and diagnostic testing showed the animal was dehydrated and had clinical signs consistent with a proximal intestinal obstruction (decreased fecal output, significantly distended third gastric compartment, empty small intestine…

February 2017 Case of the Month Read More »

Different types of bias

Comparison of different hematologic tests between a new method (Y axis) and old method (X axis). The dots represent samples tested with both methods and the black line is the line of best fit (Passing-Bablock regression equation or y = mx + x. A: No bias: With this test, the agreement is good (high correlation or r squared > 0.98) and the line of best fit overlaps with the line of identity, indicating no bias. There is minimal dispersion around…

Different types of bias Read More »

Outline of normal bilirubin metabolism

…either stored in the gall bladder (for those species with a gall bladder) or excreted directly into the small intestine. Within the small intestine, the conjugated bilirubin is degraded by bacterial proteases to urobilinogen, around 10% of which undergoes enterohepatic recirculation after uptake by the portal vein. The “reclaimed” urobilinogen is then freely filtered by the glomerulus and is found in urine (there is a pad for urobilin…

Outline of normal bilirubin metabolism Read More »

2023 Case #3

…erval, 0.6-2.2 mmol/L). Blood was taken after admission for a large animal hemogram plus fibrinogen (EDTA tube) and biochemical panel (heparin tube). Results are shown below along with images of the blood smear. After examining the results, answer the questions below. What is the mechanism of the anemia in the cow? Can you identify a cause for the anemia in the cow? How do you explain the lymphocytosis and what additional tests could you conside…

2023 Case #3 Read More »

Case #3 2024

…) Figure 2: Subconjunctival mass aspirate (50x) Figure 3: Subconjunctival mass aspirate (10x) Additional tests Figure 4: Subconjunctival mass biopsy (H&E) An excisional biopsy of the mass was performed and submitted for histopathologic examination. The specimen consisted of seven fragmented sections , composed of sheets of round to polygonal neoplastic cells supported by a scant amount of collagenous stroma. Most of the neoplastic cel…

Case #3 2024 Read More »

Gaussian and non-Gaussian frequency distribution

Frequency distribution curve (counts versus test result) of bicarbonate and creatine kinase (CK) results obtained from 124 dogs as part of a reference interval determination study at Cornell University. Bicarbonate results from the dogs show a symmetrical distribution around the mean value, indicating that parametric statistical methods can be used to establish the interval, i.e. mean+/-2SD. The vertical blue lines at either end of both graphs…

Gaussian and non-Gaussian frequency distribution Read More »

Scroll to Top