
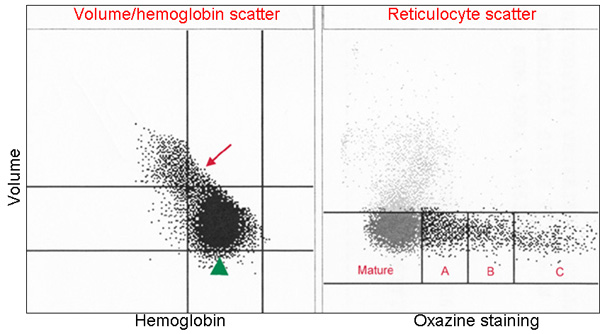
Right panel: Red blood cell volume versus hemoglobin scatterplot: The Y-axis represents red blood cell volume and the X-axis represents red blood cell hemoglobin. Normocytic normochromic red blood cells fall in the center box (green arrowhead), whereas polychromatophilic erythrocytes (which are larger and have less hemoglobin than mature red blood cells) stream off the cluster of normal red blood cells into the upper left hand box (larger volume, lower hemoglobin, red arrow).
Left panel: Reticulocyte scatter plot: This represents the degree of oxazine staining (RNA; absorption of the nucleic acid binding dye) in the erythrocytes. Mature red blood cells (mature) take up very little oxazine. Reticulocytes have varying degrees of dye-binding, resulting in low (A), intermediate (B) and high (C) levels of absorption. Studies done in our laboratory have shown that the results of the combined gates (A-C) correspond well to new methylene blue-obtained reticulocyte counts in dogs and to aggregate reticulocyte counts in cats.