
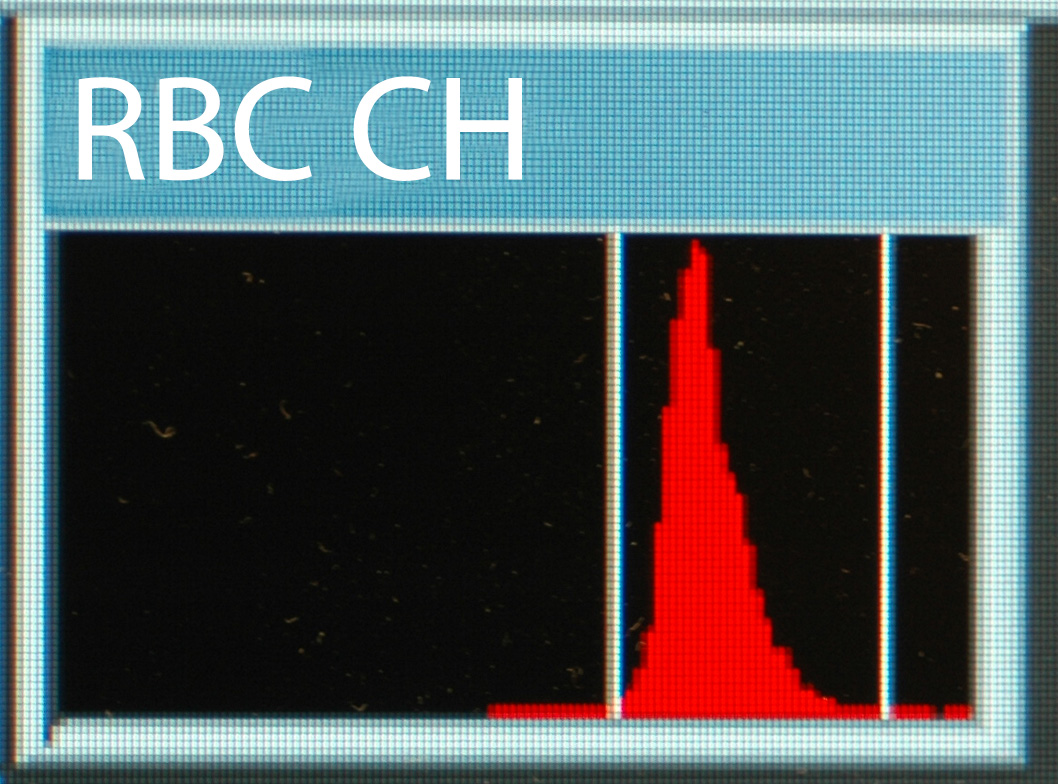
The ADVIA hematology analyzer separates RBCs based on internal complexity, which scatters light according to the content or amount (pg) of hemoglobin within the RBCs. It then creates a histogram, consisting o cell numbers on the Y-axis and cellular hemoglobin content (CH) on the X-axis, ranging from 0-100 pg. The mean CH result is provided by the analyzer.