
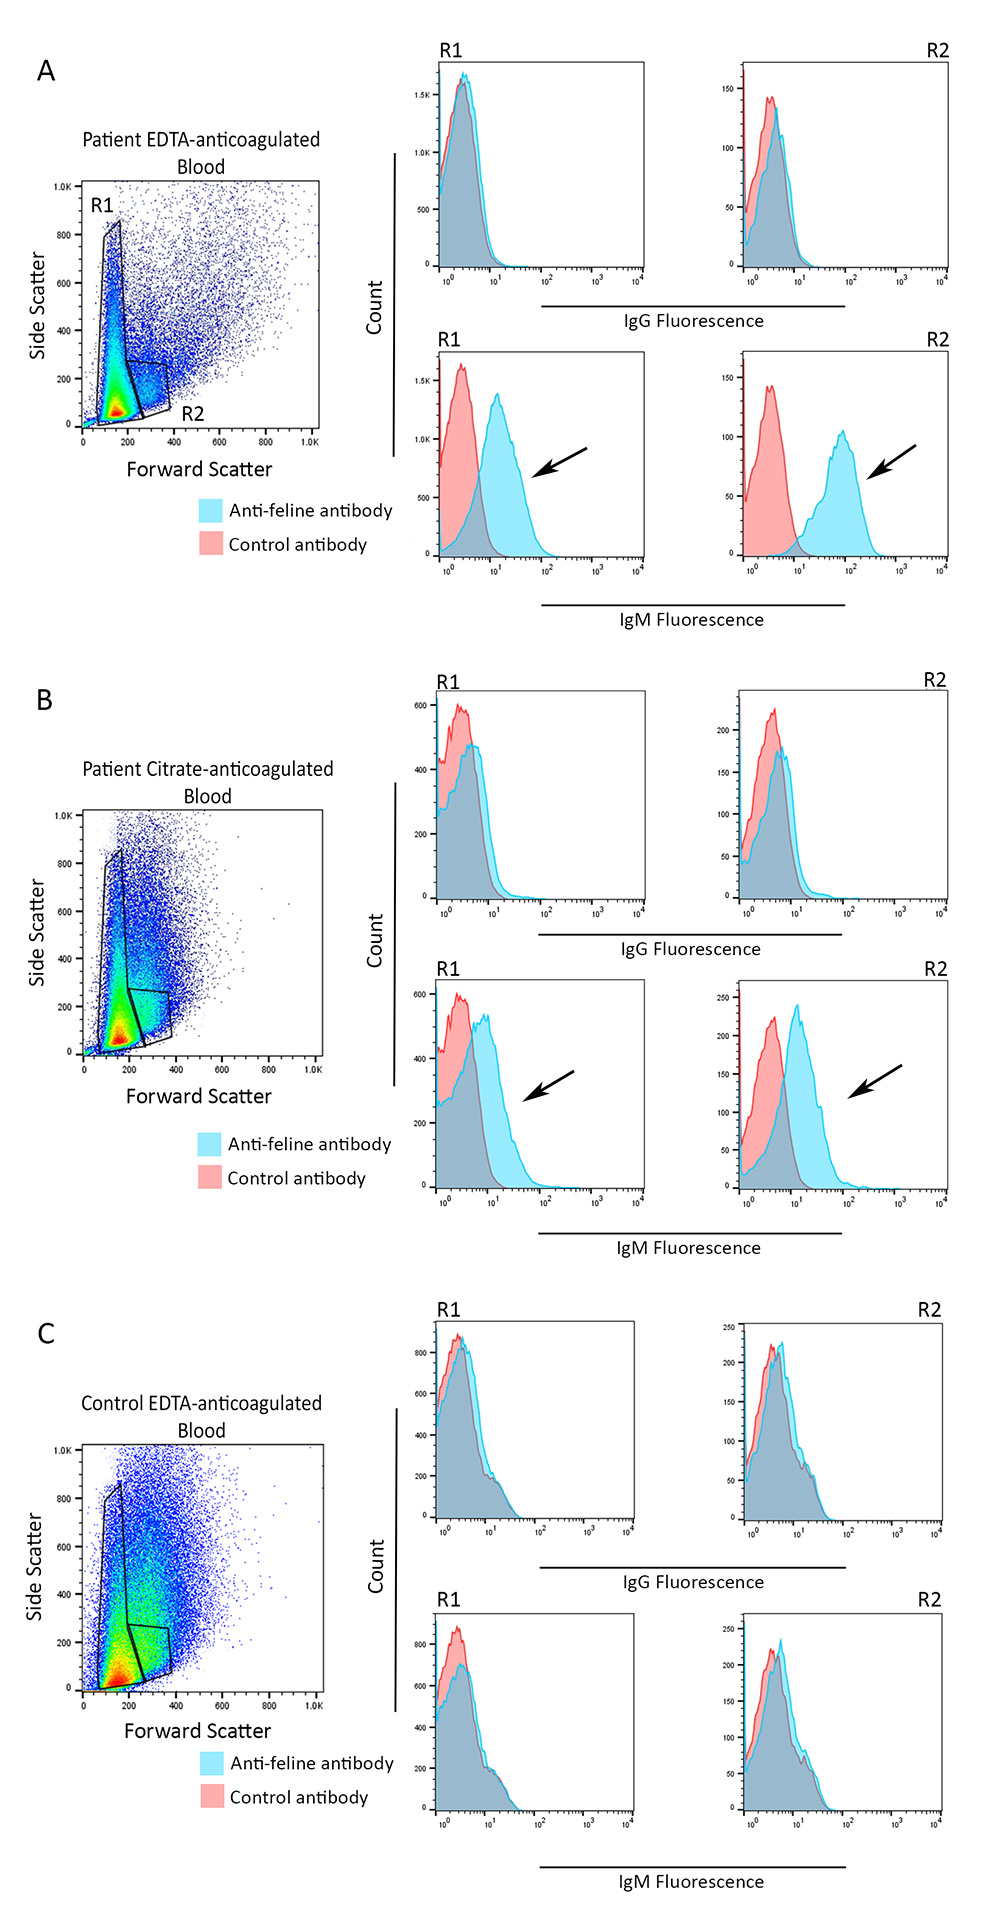
Flow cytometric testing for RBC-bound IgG and IgM antibodies in the blood of an anemic cat with EDTA-induced agglutination (A: EDTA-anticoagulated blood, B: Citrate-anticoagulated blood) and a non-anemic control cat (C: EDTA-anticoagulated blood). Two distinct RBC populations were evident in forward and side scatter plots of EDTA-anticoagulated blood from the anemic cat and were gated and analyzed separately (R1 and R2) for all samples. Histogram plots showed that the RBC populations in both gates contained bound IgM, but not IgG (A, B), with stronger binding evident in the EDTA- (A) versus the citrate- (B) anticoagulated blood (arrows, lower panels for EDTA and citrate samples). The RBCs from the control cat lacked bound antibodies (C). Solid blue curves in histogram plots represent the conjugated polyclonal goat anti-feline IgM or IgG antibodies (1:20 dilution), whereas the solid pink curves represent the control conjugated polyclonal goat antibody (1:20 dilution).