
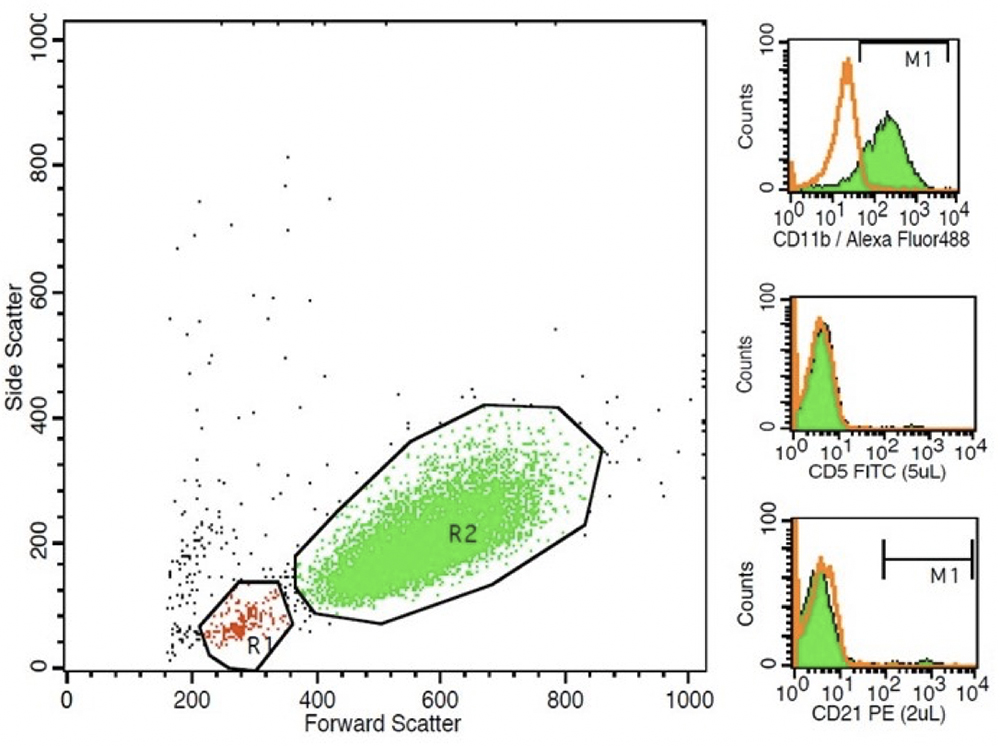
A forward (x-axis) and side (y-axis) scatter plot revealed 2 clouds of cells, with the R1 gate (red) consisting of small residual lymphocytes and the R2 gate (green) consisting of the tumor population. The right panels are frequency distribution curves (histograms) of fluorescent intensity of the antibody against the relevant leukocyte marker (green solid curve) with overlaid isotype control (open orange curve). The M1 marker represents cells that have bound the antibody (positive). The tumor cells in the R2 gate were positive for CD11b (neutrophil or monocyte marker, top right panel), and negative for CD5 (T cell marker, middle right panel) and CD21 (B cell marker, lower right panel).