
Laboratory data is usually interpreted with respect to population-based reference intervals but for some analytes in which intraindividual (within animal) variation is less than interindividual (between animal) variation, subject-based reference values may be more applicable (see more below).
Population-based reference intervals
Reference intervals (also called, although incorrectly, normal ranges or reference ranges) are intervals calculated from a group or population of healthy adult animals of a given species for a given test (this is why they are called population-based reference intervals). These intervals are used to help identify abnormalities in a sick patient. Ideally, reference intervals should be established by each laboratory, as they are instrumentation and reagent dependent. For this reason, reference intervals can vary considerably from one laboratory to another. When the species in question does not have a population-based reference interval provided by the laboratory with the test results, we need to rely on published data, if available for that species, as a guide to interpreting test results. However, published “normal” values may not be valid for results generated by your laboratory. You should also be cautious when interpreting changes in laboratory data sequentially in one patient when the data has been obtained from different laboratories. In addition, one cannot simple apply another laboratory’s interval to another instrument, e.g. point-of-care instrument in a veterinary clinic. You can use another laboratory’s reference intervals as a guideline, but because different instrumentation and methods can yield quite disparate results, you should be careful when doing so. Remember, always, to interpret the laboratory data with respect to what you know of your patient! Does it make sense? If not, repeat the testing particularly if concerned about the test result (e.g. high ALT activity).
Selection criteria
Extensive guidelines for establishing reference intervals, including number of animals, have been established by the American Society of Veterinary Clinical Pathology (Friedrichs et al 2012). To establish population-based reference intervals, blood is sampled from a large number (ideally a minimum of 120) animals of a particular species, using a mixture of breeds, ages and gender.
Ideally, samples should be collected from animals reflecting your hospital or laboratory population (e.g. if your laboratory only tests pets, samples should not be collected from research animals for reference intervals). While it is possible to formulate age- or breed-specific reference intervals, this is impractical and costly. General criteria for inclusion of animals in reference interval determination are:
- Healthy: This is usually judged clinically, but serologic testing in some species (e.g. feline leukemia virus and feline immunodeficiency virus for cats, bovine leukemia virus for cattle) is often included. It can be difficult to identify animals that are completely free of disease. For this reason, low numbers of animals with certain diseases, e.g. atopy, fungal overgrowth in ears, that are not expected to substantially change clinical pathologic test results, can be included in the population for reference interval determination.
- Adult: Because there are known differences in some clinical pathologic test results in young animals (a physiologic uncontrollable pre-analytical variable) (e.g. Brommer et al 2001, Brun-Hansen et al 2006, Rossett et al 2012, Veronesi et al 2014), animals should be adults. When does an animal become an adult? This depends on both species and breed. Generally, we default to 1 year of age for most species, however there is evidence that this may not be sufficient. For instance, we have data showing that Icelandic horses as old as 3 years 0f age have some clinical pathologic test results that are significantly different from animals older than 5 years of age. This data suggests that “adult” may be a horse older than 5 years of age. Similarly, large breeds of dogs may not be fully “adult” until 2 years of age. At the other end of the age spectrum, older animals may have subclinical disease and testing is avoided in geriatrics (>15 years for cats, > 10 years for dogs, >20 years for horses). Of course, subclinical disease may be present in some animals younger than these cut-offs, however such animals may be detectable outliers when analyzing the data (see more on outliers below).
- Not being treated with drugs that can affect test results: There are some drugs, such as heartworm prophylaxis in dogs, which will not affect test results, however others, such as corticosteroids, may have some effect. For other drugs, e.g. anti-anxiety and non-corticosteroid atopy medication, the effect on clinical pathologic tests is unknown and such animals may be included. If results from such animals are outliers, drug treatment is a valid reason for exclusion of the result from that animal when establishing the interval.
- If female, not late pregnant or in early lactation: These physiologic states are uncontrollable pre-analytical variables that we know from published studies affect results of some clinical pathology tests (e.g. Mariella et al 2014, Moretti et al 2017).
- Different environments: This is particularly important for herbivores, where diet and husbandry, may influence results. For cattle and horses, samples should be collected from several versus one herd to prevent herd- or environment-associated biases.
Other criteria to consider for reference interval determination are sample type for biochemical analytes (heparinized plasma or serum – intervals for some analytes, such as potassium, protein and globulins, will differ between plasma and serum due to the effect of clotting), season (samples should be collected over several months versus all in one season), and timing of analysis after collection. Because of the known effects of sample storage on clinical pathologic test results, samples should be collected and handled under optimal conditions, e.g. good venipuncturist, keep cool, analyze within 2 hours of collection). The latter is not always possible, e.g. all herds are >2 hours away, so some compromises may be needed.
Method of determination
The standard is that reference intervals include the middle 95% of the data and will exclude 5% of results from clinically healthy animals – 2.5% at the top end and 2.5% at the bottom end. Statistical programs, which sort or rank the data, are used to determine the intervals, which consist of the upper and lower limits of the interval and 90 or 95% confidence limits of these upper and lower limits. Which statistical method the program uses to establish the interval depends on the distribution of the data for that analyte or test:
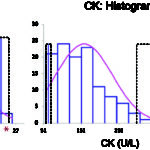
- Gaussian (normal) distribution: This is when the data is normally distributed, i.e. distributed symmetrically around the mean, the reference interval is calculated using parametric statistical methods as the mean ± 2 standard deviation (SD), which encompasses 95% of the observations in healthy animals (see image to right).
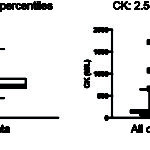
- Non-Gaussian (non-normal) distribution: For data that is non-Gaussian (e.g. skewed or curved, see image to the right), the data can be mathematically transformed, e.g. to logarithms. If this yields a Gaussian distribution, the geometric mean ± 2 SD can be used for reference interval determination (geometric means are based on the log-transformed data). However, in most instances, non-parametric statistical methods, specifically percentiles, are used to create reference intervals from non-Gaussian data. The top 97.5 and bottom 2.5 percentiles are used as the upper and lower limits of the reference interval (includes only the middle 95% of data, just like Gaussian data). Sufficient numbers of animals are required before percentiles are used (minimum of 50, although 120 is ideal and will yield confidence limits on the reference interval limits). As many clinical pathologic tests yield data that is not normally distributed, this is usually the default technique for reference interval determination
Percentiles and outliers
Identification of outliers is also part of reference interval determination (see CK example in the image above). This is usually done statistically with the program, however the result should always be verified by visual inspection. This is because tests with a small range of results in clinically healthy animals, e.g. total bilirubin in dogs, a result that is within analytical variation may be erroneously flagged as an outlier by the program. For example, 25 results of 0 mg/dL and 5 results of 0.2 mg/dL for total bilirubin from 124 dogs were flagged as outliers by the program in a reference interval determination done in our laboratory. However, because of analytical variation, 0 is not different from 0.1 or 0.2 mg/dL. In addition, if several animals have extreme values, the statistical methods used to identify outliers may not recognize these extreme values. Ultimately, it is the decision of the clinical pathologist examining the data for inclusion or exclusion of outliers. This is based on a good measure of common sense as well as knowledge of the importance of the test result. If outliers are included in reference interval determination, you are compromising sensitivity (true positives) for the sake of specificity (false positives) as the reference interval will naturally be broader. If you exclude outliers, you will narrow the interval, which means you are compromising specificity for sensitivity, which may be more important for that particular test result. The general rule of thumb is that outliers should be left in whenever possible unless a valid reason is identified for their exclusion (e.g. known error in analysis or collection, a known pre-analytical error).
As a result of the technique for establishing reference intervals, up to 5% of normal animals may have values that fall outside (2.5% above and 2.5% below) the reference interval for a given test. When numerous tests are run on the same animal, the chances of obtaining one or more slightly “abnormal” results on an animal that actually is normal rises (p = 1 – 0.95n). For 12 tests, p = 0.46; for 21 tests, p = 0.66. Thus, if you have a panel of 20 tests, it is likely at least one will be abnormal as a matter of chance or “normality” versus disease. What this means is that small deviations outside the reference interval may not be clinically relevant. In other words, clinically healthy animals may have mildly reduced or increased analyte concentrations or activities compared to a reference interval, but the values are actually normal for that animal.
So how do you know when it is safe to assume that a value outside of the reference interval is not clinically relevant? This will be somewhat dependent on the analyte, e.g. mild increases in liver enzymes may not be diagnostically relevant (depending on clinical signs), however electrolytes are maintained within fairly narrow limits and alterations are more likely to be clinically relevant (again, depending on clinical signs and other findings – interpret with what you know about the case). The following criteria can be used as a guide, by which you can be reasonably safe to assume that a high or low result is not “actionable” (i.e. dictating a treatment or management decision):
- The change is mild.
- The change is not accompanied by other laboratory results or clinical signs/examination or imaging findings that would be associated with a particular pathologic process (e.g. a very mild increase in ALT activity without increases in other liver test results and without any clinical signs associated with liver disease), i.e. no evidence of a disease-associated reason for the change.
- The change is not associated with any known pathology (e.g. decrease in ALP activity).
- The change can be readily explained by a pre-analytical variable, e.g. age, sex, reproductive status, breed, drugs.
However, if in doubt as to whether an abnormal test result is a disease-associated finding, you can always retest to see if the identified change is persistent or getting worse (the interval between testing is subjective but can be determined by the test, for example if the abnormal result is in the hemogram, retesting in 24-48 hours is typical; if a liver enzyme increase – retesting can be done in 1-2 weeks).
Subject-based reference values
We now know that there are certain analytes in which population-based reference intervals may not be the best way for establishing “normal” or identifying “abnormal”. This is because of biological variation, i.e. inherent differences that occur naturally within (intra) and between (inter) individuals. These differences are due to diet, breed, sex, environment, genetics etc. So how does intra- and inter-individual biological variation affect interpretation of test results?
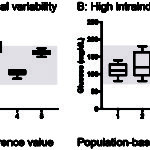
- If the biologic (day-to-day) variation within an individual animal is larger than that seen between animals in the population, population-based intervals are appropriate (see figure to the right).
- If the variation within an individual is less than that in the population, this means that population-based intervals may not be the best method of detecting an abnormal test result in that individual (see figure to the right). In the latter scenario, a change in the individual animal’s result from an established baseline for that animal may be the best way of picking up a test abnormality that is due to disease. This change, called the reference change value (also called the critical difference), gives rise to the subject-based reference value (see review by Walton et al 2012). So if the test result changes from baseline more than the reference change value, this supports a true change versus that just due to chance. However, as for any test result, the change in analyte values may be due to pre-analytical variables (e.g. breed) versus disease (so you still have to figure this out).
There is published data for subject-based reference values and reference change values for hematologic, biochemical and coagulation tests in various species (Baral et al 2014, Bourgès-Abella et al 2015, Falkenö et al 2016, Scruggs et al 2016, Wright et al 2018). These studies show that test results for most hematologic or biochemical analytes fall in a gray zone, i.e. where it is not clear-cut to use population-based reference intervals or subject-based reference values (see method of determination below). In addition, just like population-based intervals, the animals, instrument and methods used to establish the reference change value or critical difference will affect the obtained values, so any published values should be used as a guide in test interpretation. Indeed, there are differences between the published studies in the actual value for the reference change value and the tests to which applies. This can be attributed to differences in study methods, including instrument, method, and reagent and lack of standardization as to numbers of animals, frequency of blood sampling, methods used to measure analytical variation and even the formula and cut-off used to determine if subject-based reference values apply (see below).
Method of determination
To determine if population-based reference intervals or subject-based reference values apply for a given laboratory test, blood is collected from several different animals on multiple occasions, generally at the same time of the day and under the same housing conditions, to minimize the effect of these variables on test results. As stated above, there is no standardization between studies on either animal numbers nor frequency of sampling. There also needs to be an assessment of the analytical variation or, specifically, the precision of the instrumentation used in the study, however the method for determining assay precision is not always clearly stated in the published studies (it likely represents between day variation in relation to quality control material).
The variability within animals (intraindividual coefficient of variation or CVi), analytical precision (coefficient of variation or CVa) and variability between dogs (interindividual or group coefficient of variation, CVg) are combined in the following formula called the index of individuality:
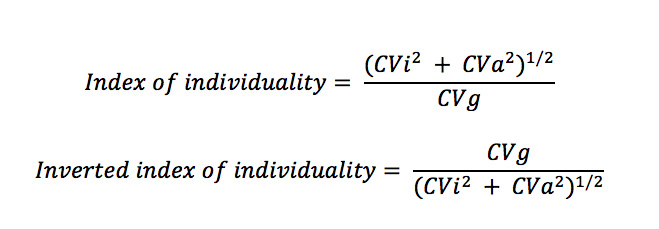
The original index of individuality (top equation) is counter-intuitive, because low intraindividual variation (CVi) or a test where the variation within individuals is less than the group or population (CVi < CVg) would lead to a low index of individuality, supporting the use of subject-based reference values. One rather thinks of individuality as the individual taking precedence over the group, so the inverted or inverse formula (bottom formula) is more intuitive, where low intraindividual variation (CVi < CVg) would lead to high individuality and the use of subject-based reference values – see below for more detailed information.
- Index of individuality (top equation): As stated above, the values used for the cut-offs vary between studies.
- <0.6 (low index of individuality): Use subject-based reference values or the reference change value (see equation below). From two studies in cats (Baral et al 2014, Falkenö et al 2016), ALT, albumin, cholesterol and creatinine had low index of individuality. In dogs, due to a low index of individuality, a reference change value of 0.3 or higher in creatinine is used in the International Renal Interest Society (IRIS) guidelines for identifying acute kidney injury.
- 0.6-1.4 (equivocal index of individuality): Use population-based reference intervals with caution (not sure what this really means; in our view, all of these should be interpreted with caution due to the caveats mentioned above). Most tests fall within this unhelpful category.
- >1.4 (high index of individuality): Use population-based intervals. The tests that fall into this category differ between studies.
- Inverted index of individuality (lower equation):
- <0.6-0.7 (low individuality): Use population-based reference intervals.
- 0.6-1.4: Equivocal (see above).
- >1.4-1.7 (high individuality): Use subject-based reference values.
Reference change values (RCV) or the critical difference is determined from the following formula:
RCV = Z(2(CVa2 + CVi2)0.5), where
Z= 1.65 if one-sided (only an increase or only a decrease)
Z = 1.96 if two-sided (i.e. an increase or decrease is relevant
Again, reference change values have been published for various tests, however these should be used as a guide.
Population versus subject intervals
It is hard to keep track of individual reference change values for the multiple test we run, let alone for each species, and population-based reference intervals are easy to use when provided by the laboratory. So, as a practicing veterinarian, which of these methods should you use for identifying abnormalities that may indicate underlying disease? Our bottom line is:
- Use common sense.
- Always interpret laboratory data with respect to your knowledge of the animal (signalment, history, clinical signs, physical examination and imaging findings). Don’t interpret results in isolation.
- Use population-based reference intervals, but don’t get hung up on numbers and recognize the effect of pre-analytical and other (analytical, post-analytical) variables on your test results.
- Incorporate subject-based reference intervals when possible: Establish what is “normal” for an individual animal, by performing baseline blood testing when the animal is an adult and, ideally, test at annual examinations. This way you can identify changes in laboratory test results over time for that individual animal, i.e. you can use subject-based changes and population-based reference intervals together along with common sense.
- Note, changes in results of an individual animal over time are completely dependent on you using the same laboratory, instrumentation and methods over time, because if these fixed variables substantially change, difference in test results may be due to the analysis and have nothing to do with your patient.
- When in doubt, repeat a questionable or concerning test result to look for trends in data. Is it getting worse or improving?
Reference intervals used by the Animal Health Diagnostic Center of Cornell University
The reference intervals provided by the Animal Health Diagnostic Center of Cornell University were established from healthy animals, using the equipment with specific methods and reagents. Because results are analyzer-, method- and reagent- dependent, these intervals are only valid for results from our laboratory. Reference intervals are available for hematology and chemistry tests for dogs, cats, horses, cattle, goats and alpacas and blood gas and electrolyte intervals for dogs, cats, horses and cattle. For species without established reference intervals, one should refer to general publications and textbooks as a guideline only. With many of the tests, (e.g. immunology) the manufacturers’ intervals are used, or not provided at all, however guidelines for interpretation are usually provided.
Our most recent intervals were established by collecting blood from at least 120 adult healthy animals. These healthy animals were obtained from a variety of sources (eg, student- or faculty-owned). Therefore, the reference intervals are only applicable for adult animals and not young animals. Results from young animals may fall outside our reference intervals because of age-dependent changes in test results. For example, phosphate concentrations and alkaline phosphatase activity are higher in young animals and decrease to within reference intervals at about one year of age. Foals and calves have microcytic erythrocytes until one year of age. Hematocrits are lower and lymphocyte counts are higher in puppies and kittens under four months of age. Similarly, immunoglobin concentrations are lower in animals under one year of age.