
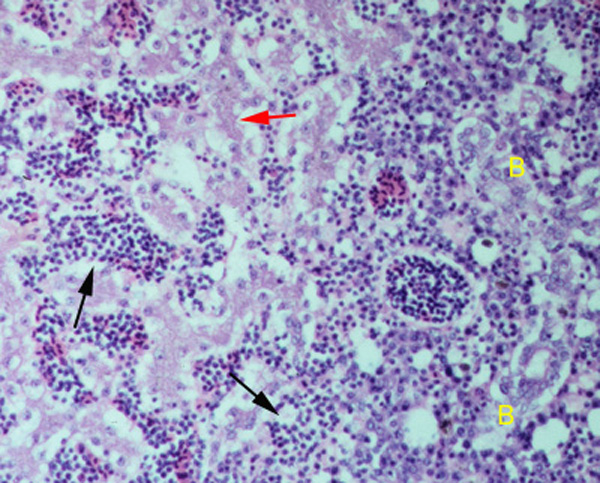
Figure 4: Extensive infiltrates of small lymphocytes are seen in the hepatic sinusoids (black arrows). Hepatocyte cords display some shrinkage and autolysis (post-mortem artifact, red arrow). A few biliary profiles are evident (B). (haematoxylin-eosin stain, 63x magnification)