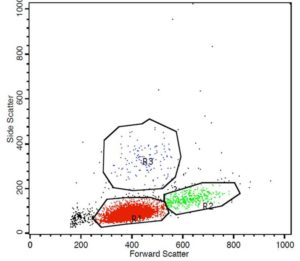
A forward and side scatter dot plot shows an atypical population of cells in the R1 and R2 gates with a median forward scatter (cell size) of 408 units (intermediate-sized cells) and 630 units (large-sized cells), respectively. The R3 gate corresponds to the neutrophil gate. Side scatter indicates cellular complexity or granularity and nuclear shape.

