
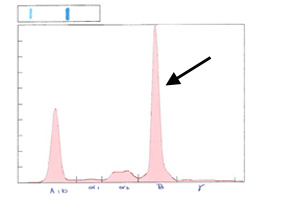
Figure 3a: Serum protein electrophoresis from the patient. Note the sharp peak in the beta region (arrow) indicating a monoclonal gammopathy.
Figure 3a: Serum protein electrophoresis from the patient. Note the sharp peak in the beta region (arrow) indicating a monoclonal gammopathy.
eClinpath helped 1.2 million visitors last year from 220 countries find important information on animal health. If you enjoy the site, please support our mission and consider a small gift to help us keep pace with its rapid growth. You can donate securely via PayPal or credit card. Thank you!
![]()