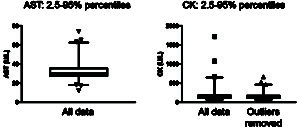
Reference interval determination by percentiles and identification of outliers : On the left, the 97.5 percentiles for AST are shown. The data was not normally distributed as seen by the median (line in the box) being towards the lower end of the box. The whiskers represent the upper 97.5 (upper reference limit) and lower 2.5 (lower reference limit) percentiles. The dogs with results (triangles) above or below these percentiles will naturally be excluded from the intervals (upper and lower 2.5% = 5% of all results), however there results are “normal” for these dogs. Note, that there are no clear results that are vastly beyond the whiskers, indicating no outliers. In contrast, in the right panel, the results for CK activity are shown. From all the data, there are 3 dogs with very high values. These were identified as outliers both visually and by the program and were excluded. Once those outliers were removed, there were another 3 dogs with values also above the main population of dogs. Could these be outliers? They were not identified as outliers by the program, but visually they still could be. The decision to leave in or remove is up to the clinical pathologist, because these will make the reference interval broader if left in. Does it matter having a slightly broader reference interval for CK activity. Likely not, as it means mild muscle injury would be missed (false negative). Would it matter for something like ALT activity or calcium concentration – likely yes. All of these high CK values could be a preanalytical variable due to a muscle stick (also see the previous figure on data distribution).

