
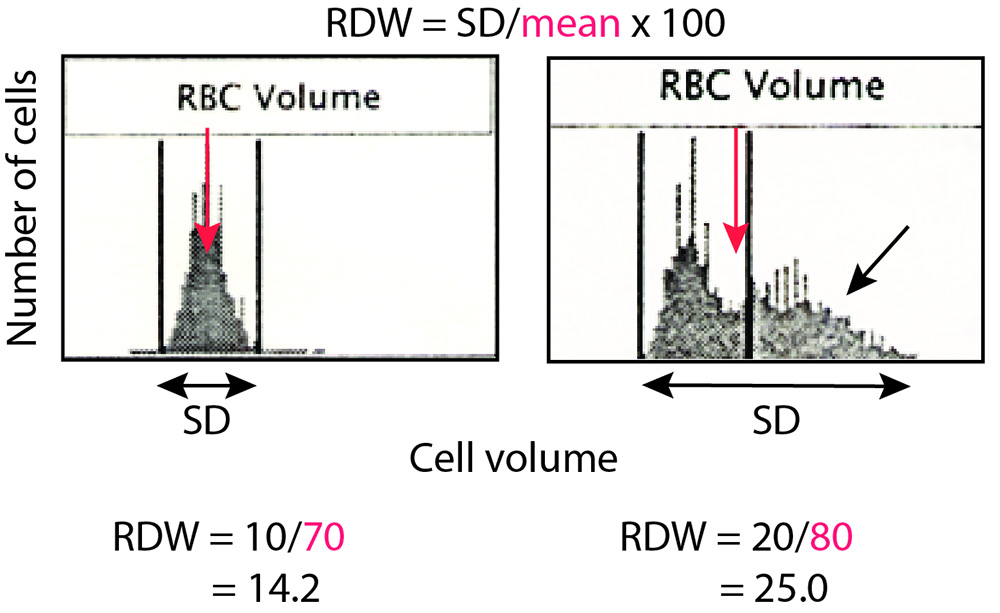
The RDW is a measure of the coefficient of variation of the red blood cell (RBC) volume which is equal to the standard deviation of the volume (a measure of the spread of the data) divided by the mean. In these two images from an automated hematology analyzer (ADVIA series), this concept is graphically displayed. The images are histograms representing cell number on the Y-axis and RBC volume on the X-axis, i.e. they are frequency distribution curves or histograms. In the histogram from a normal dog (image on the left), the RBCs form a normal distribution and the SD represents the spread of data (black double arrow, e.g. 10 fL) whereas the red arrow represents the mean cell volume (70 fL). The RDW (%) is the SD/mean x 100 = 14.2%. In the image on the right which represents a histogram from a dog with a strong regenerative anemia and many polychromatophils (which are larger than normal RBC), there are additional larger RBCs (arrow), which shift the mean up to 80 fL. However, the spread of the RBC volume or SD is much larger (20 fL), resulting in a high RDW (25% or 20/80), even with the increased mean volume.