
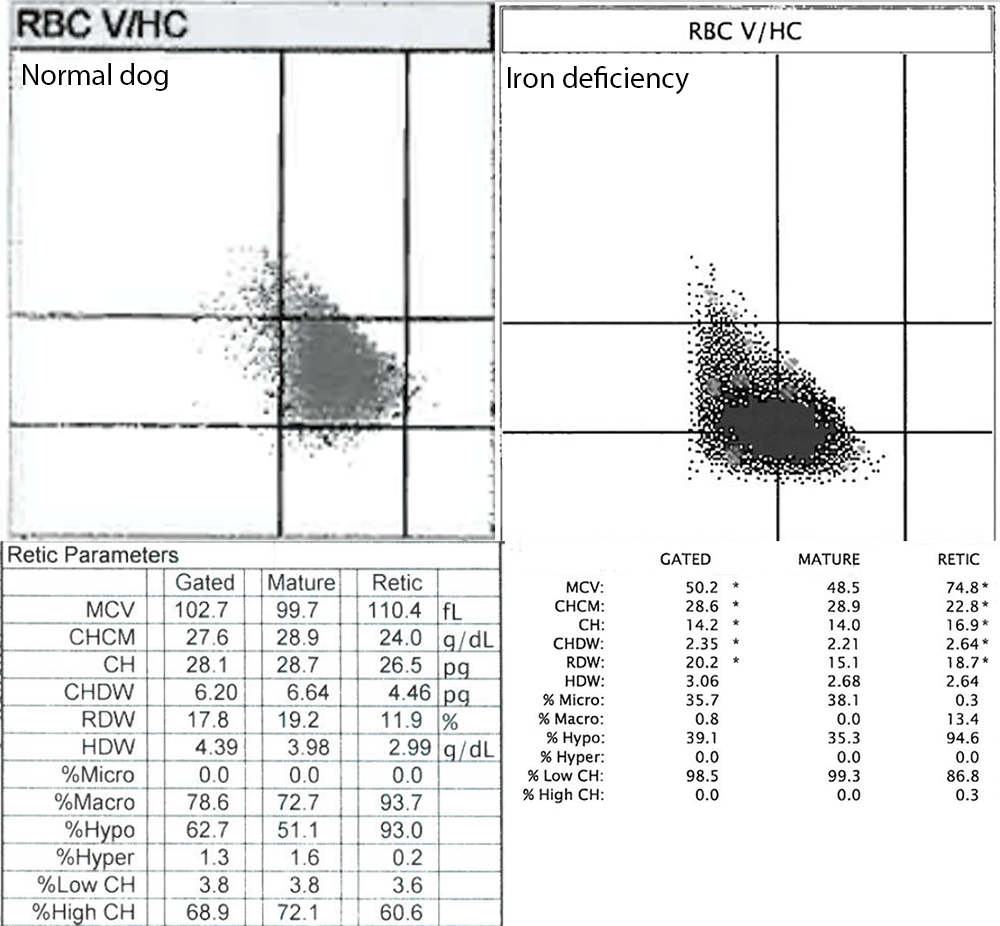
In the ADVIA runsheet from the healthy dog (left images), the red blood cells (RBCs) fall in the central part of the checkerboard plot for hemoglobin (X-axis) versus MCV (Y-axis), indicating they are mostly normocytic to normochromic (upper left image). Results for the reticulocyte indices (far right column of lower left image) fall within reference intervals established for our laboratory (Schaefer and Stokol, Vet Clin Pathol 2015 44:109). Note how the reticulocyte MCV and hemoglobin concentration results (CH and CHCM) is higher and lower than the mature cells (middle column), with the entire gated population reflecting a proportional balance of the two subsets of RBCs (mature and immature). The CHr and % low CHr are above and below the cut-offs determined for established iron deficiency in dogs, <20.1 pg and <50%, respectively (Schaefer and Stokol 2015). In contrast, the checkerboard plot from a dog with established iron deficiency anemia (upper right image) shows that the RBCs fall in the lower left quadrant (microcytic and hypochromic). The numerical RBC indices (lower right image) show features classic of iron deficiency, including a CHr < 20.1 pg and % low CHr above 50%. Other supportive cutoffs are the CHCMr < 26 g/dL and % of reticulocytes with low CHCM (% hypo) >74%. The MCV and CHCM of the reticulocytes are higher and lower than the mature subset, respectively, similar to the healthy dog, but the CHr is higher than the CHmature, likely due to the larger volume of the immature RBCs. The delta results (difference between reticulocyte and mature subsets) are not shown.