
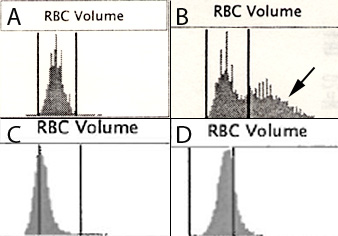
Changes in mean cell volume (MCV) histograms (frequency distribution curves) with disease or artifact. These curves were obtained from our hematology analyzer.
A: MCV histogram from a normal dog. The RBC form a symmetrical normally distributed bell-shaped curve with most of the RBC having volumes that fall in the middle of the reference interval (lower and upper limits represented by the vertical lines on either side of the histogram). B: MCV histogram from a dog with a strong regenerative anemia. A second population of macrocytic RBC (arrow) is seen, corresponding to immature anucleate RBC (polychromatophils or reticulocytes). The dog did have a high MCV (sufficient reticulocytes were present to increase the MCV above the upper reference limit). The corresponding red blood cell distribution width (RDW) would be high in this dog (the RDW would represent the entire width of the histogram which is far wider than that seen in the histogram from the normal dog. C: MCV histogram from a dog with iron deficiency anemia. The iron deficiency has been long-standing so all of the RBC are microcytic; indeed the MCV was 45 fL in this dog (far below the lower reference limit) and there was no evidence of a regenerative response. D: MCV histogram of a blood sample from a cat that was received in the laboratory and analyzed 24 hours after collection. The RBC have swollen with storage due to water uptake, increasing the MCV (entire curve is shifted to the right). This would result in an increased MCV and decreased MCHC (hemoglobin would be diluted by the water) and both RBC indices were abnormal in this cat (above and below the reference limits, respectively). The RDW would be increased in both the dog with iron deficiency and the “aged” cat sample, however not as much as the dog with a regenerative anemia.