
Bone marrow aspirate evaluation should always be performed by a clinical pathologist. However, you should know what to expect from a bone marrow report and how the findings are interpreted. Bone marrow evaluation includes an assessment of the following: An estimate of cellularity, evaluation of all hematopoietic lineages (including an M:E ratio), estimation of iron stores, and an assessment of other cell types. It is also imperative that the bone marrow findings are interpreted in context of a contemporaneous hemogram, so always submit blood for a hemogram, recent hemogram results (last 24-48 hours and sequential data, if available) or, at the very least, a good quality blood smear. Otherwise marrow interpretation will be quite limited.
Cellularity
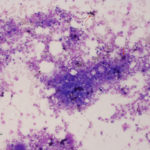
Cellularity of marrow is best assessed on a good quality core biopsy, but can usually be estimated on aspirated samples as long as there are plenty of bone marrow particles in the sample. If there are only a few bone marrow particles on the slide, it may indicate either inadequate sampling or the presence of a disease that prevents aspiration (e.g. myelofibrosis). The latter should be suspected if you are well placed in the marrow but attempts at aspiration yield little or are unsuccessful. In the latter cases, core biopsy will be needed. Evaluation of cellularity aids in determination of whether cell lines are increased or decreased within the marrow. Only nucleated cells are included in assessment of cellularity (not mature RBCs or reticulocytes, which could just indicate blood in the sample) and for normal marrow, is dominated by myeloid and erythroid precursors (megakaryocytes do not contribute much to cellularity). Cellularity can be estimated as the ratio of hematopoietic cells to fat and should be interpreted with respect to the age of the patient. Younger animals have higher cellularity (>75:25 hematopoietic cell:fat ratio) with older animals having lower cellularity (50:50 or <50:50). Cellularity will also depend on the region of marrow sampled with the aspirate. If the aspirate collected marrow closer to the diaphysis and less in the metaphyseal region, there may be less cellularity as a direct consequence of the region sampled (the diaphysis contains less active marrow). For this reason, cellularity can vary from spicule to spicule and slide to slide, resulting in an overall estimate of cellularity. In some cases, cellularity is not due to hematopoietic cells but due to a neoplasm (primary or infiltrative). In this case, cellularity may be increased due to the neoplasm, with hematopoietic cells actually being hypocellular.
Hematopoietic precursors
All three lineages of hematopoietic precursors are evaluated: Erythroid, myeloid, and megakaryocytic. The majority of precursors are erythroid and myeloid, with fewer megakaryocytes.
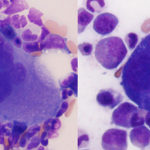
- Megakaryocytes: The number of megakaryocytes is assessed subjectively and is entirely dependent on the presence of spicules in the marrow slides. If spicules are absent, megakaryocyte numbers cannot be estimated; rather we can just indicate that they are present or absent (the latter of which may not be pathologically relevant). In addition, numbers per spicule often vary in different slides and by the method of preparing slides, but as an approximate guide, there should be 2-3 per spicule in an animal with a normal platelet count. Megakaryocyte numbers and abnormal architectural features, such as clustering, is best assessed on a good quality core biopsy. Aside from numbers, we look at maturation sequence (there should be more mature than immature megakaryocytes) and at morphologic features. Dysplasia in megakaryocytes could indicate abnormal or accelerated production and may yield clues as to mechanisms underlying a thrombocytopenia. However, the lack of morphologic abnormalities in megakaryocytes does not mean that platelet production is normal.
-
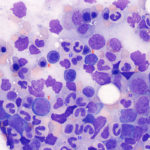
M:E ratio Myeloid and erythroid cells: With myeloid and erythroid precursors, we do the following: 1) Assess for complete and balanced maturation, 2) Calculate a myeloid to erythroid ratio, 3) Evaluate morphologic features and 4) Look at cell proportions.
- Complete and balanced maturation: For myeloid cells, this focuses on neutrophils (these are the most abundant and in terms of marrow evaluation, usually the most important granulocyte). By complete, we mean that maturation proceeds to the most mature cell, i.e. segmented neutrophils for myeloid and polychromatophilic erythrocytes for erythroid (there will always be mature RBCs). By balanced maturation, we mean that maturation should be orderly and proportional, i.e. pyramidal in that mature cells outnumber immature cells and that there are few if any myeloblasts (<1%).
- Myeloid to erythroid ratio (M:E): As part of the assessment of erythroid and myeloid lineages, we calculate a M:E ratio. The M:E ratio indicates the relative numbers of myeloid lineage cells (all granulocytic and monocytic cells) to nucleated erythroid precursors in marrow. This ratio is interpreted in relation to peripheral blood CBC results and with the bone marrow cellularity to help identify whether there is a myeloid hyperplasia or hypoplasia and/or erythroid hyperplasia or hypoplasia. In most species, the M:E ratio is normally about 1:1 to 2:1. For example, if the M:E ratio is increased, it indicates that there is either myeloid hyperplasia or an erythroid hypoplasia or a combination of both. In order to determine which (or both) is present, we primarily look at the hemogram results and also at cellularity. If there is a neutrophilia on the hemogram (particularly one that is persistent and not due to transient stress or if there is a neutrophilia with a left shift) and no anemia, an increased M:E ratio would be interpreted as a myeloid hyperplasia. Marrow cellularity may be normal or concurrently increased. If the animal has a normal neutrophil count and a persistent non-regenerative anemia, an increased M:E ratio would be attributed to an erythroid hypoplasia (marrow cellularity may be normal or decreased). If the animal has a neutrophilia and a non-regenerative anemia, then both a myeloid hyperplasia and erythroid hypoplasia are present. Marrow cellularity may be normal or increased (rarely decreased). Other support for an erythroid hypoplasia may come from other marrow findings, such as increased marrow iron from hepcidin-mediated iron sequestration in macrophages if the non-regenerative anemia is due to inflammatory disease. In addition a 1:1 M:E ratio may not be normal. If there is an anemia, we would expect a lower M:E ratio due to an erythroid hyperplasia, so a 1:1 M:E ratio may indicate an erythroid hypoplasia, unless there is a concurrent myeloid hyperplasia (confusing we know, but everything is interpreted in context).
- Morphologic features: We look at morphologic features of the cells for abnormal or accelerated maturation or other findings that can help us identify the problem. For example, we may see toxic change in mature and immature neutrophils in marrow with inflammation. We may see dysplasia or abnormal maturation if there are relative vitamin or mineral deficiencies associated with accelerated production or hyperplasia, true mineral or vitamin deficiencies (e.g. vitamin B12 or folate), drug toxicity, or primary myelodysplasia (a hematopoietic neoplasm). We may see vacuoles in immature myeloid precursors with immune-mediated or toxic marrow injury or vasculitis.
- Cell proportions: We also address proportions of the different myeloid lineages. For an example, we may see an expansion of monocytes in a recovering marrow or with inflammation. We may see increased eosinophils if there is peripheral eosinophilia and a drive for eosinophilopoiesis. On the contrary, if there is an eosinopenia, eosinophils may be “sequestered” in marrow.
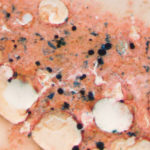
Normal iron
Iron stores
Iron stores are normally visible in most species except cats. Iron is found within macrophages as ferritin and hemosiderin, but likely only the latter is visible with regular stains or Wright’s stain. Iron can be seen in individual macrophages or as dense chunks (still within macrophages) in the spicules. Iron can be seen more distinctively using a Prussian blue stain and is subjectively assessed as adequate, increased or decreased. As for cellularity and megakaryocytes, spicules are needed to assess iron stores. Iron is usually not seen in mature or immature RBCs and the presence of iron in these cells (siderocytes if in mature RBCs and sideroblasts if in nucleated RBCs) is an abnormal finding in most species.
Evaluation of other cell types
We evaluate other cell types that can normally be present in low numbers in the bone marrow (i.e. lymphocytes, plasma cells, mast cells, and macrophages). Lymphocytes and plasma cells typically comprise <10% and <2% of all marrow cells, respectively, in dogs and horses and <20% and 2% of all marrow cells respectively, in cats. Rodents can have substantial numbers of small lymphocytes in the marrow (up to 30-40%). In contrast, macrophages and mast cells are seen in low numbers (generally they are embedded within spicules) or not at all, respectively. Any abnormal cell types (e.g. leukemia or infiltrating neoplasia) or infectious organisms (e.g. Histoplasma, Leishmania, etc.) are also reported.